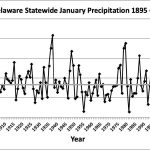
January Temperatures
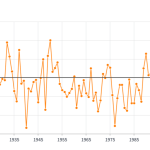
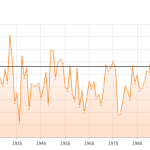
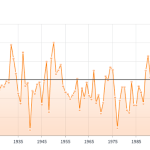
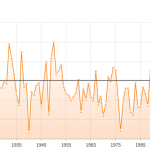
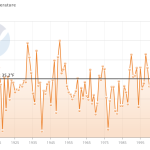
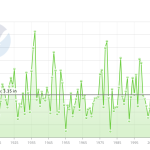
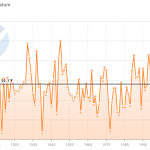
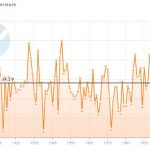
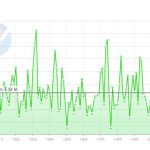
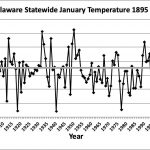
Preliminary data indicates that the statewide average temperature in January was 32.0o F, which is 3.2o F below the 1991-2020 mean value of 35.2o F (Figure 1). January 2026 was the 49th coldest January since observations began in 1895.
January Precipitation
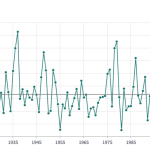
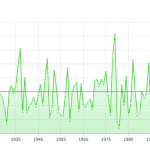
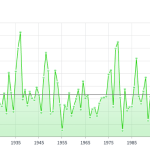
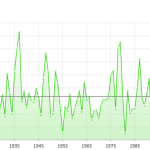
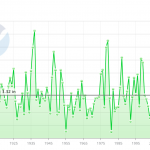
Delaware’s statewide precipitation for January 2026 averaged 3.25 inches, 0.1 inches below the 1991-2020 mean of 3.35 inches (Figure 2). Precipitation in January 2026 was near the average of all 132 January precipitation observations since 1895.
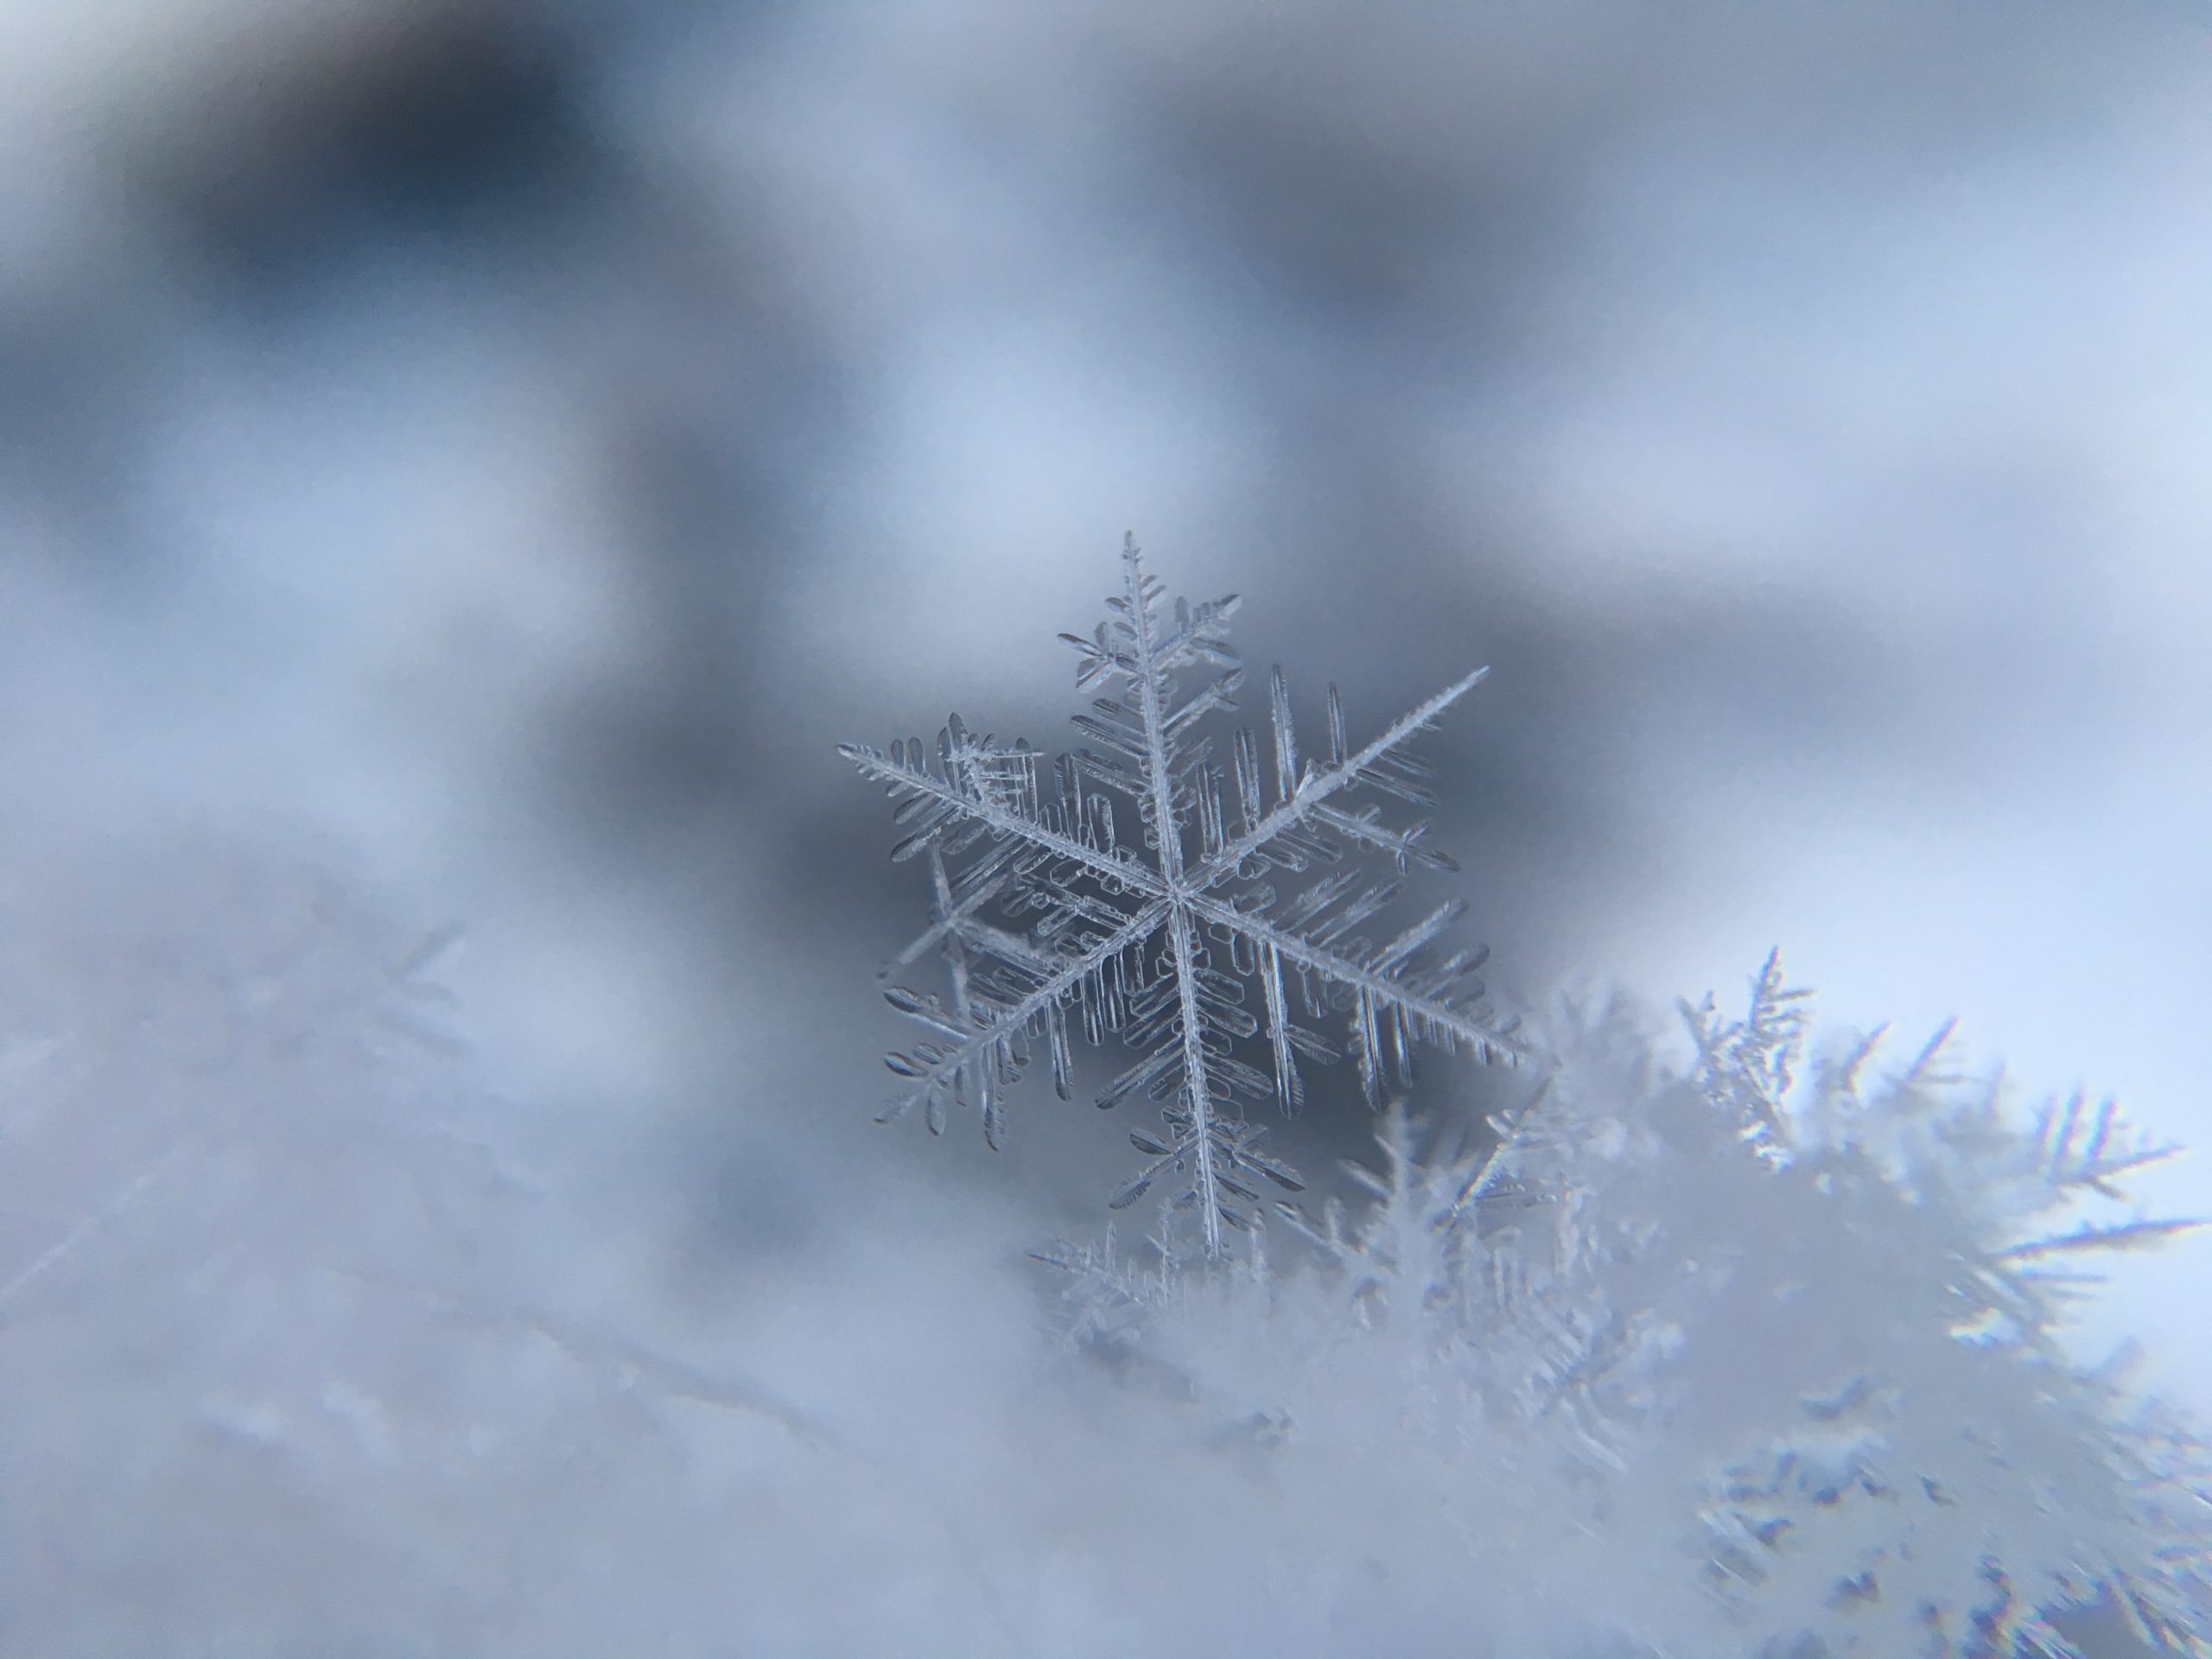
Statewide Spatial Anomalies
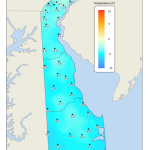
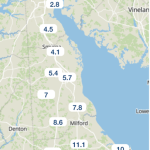
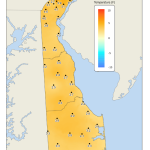
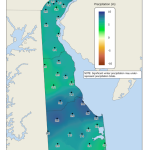
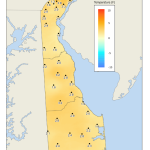
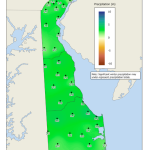
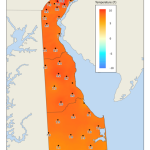
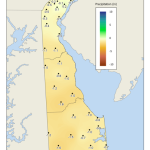
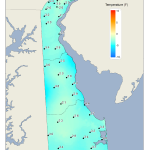
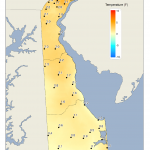
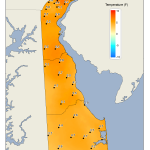
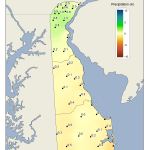
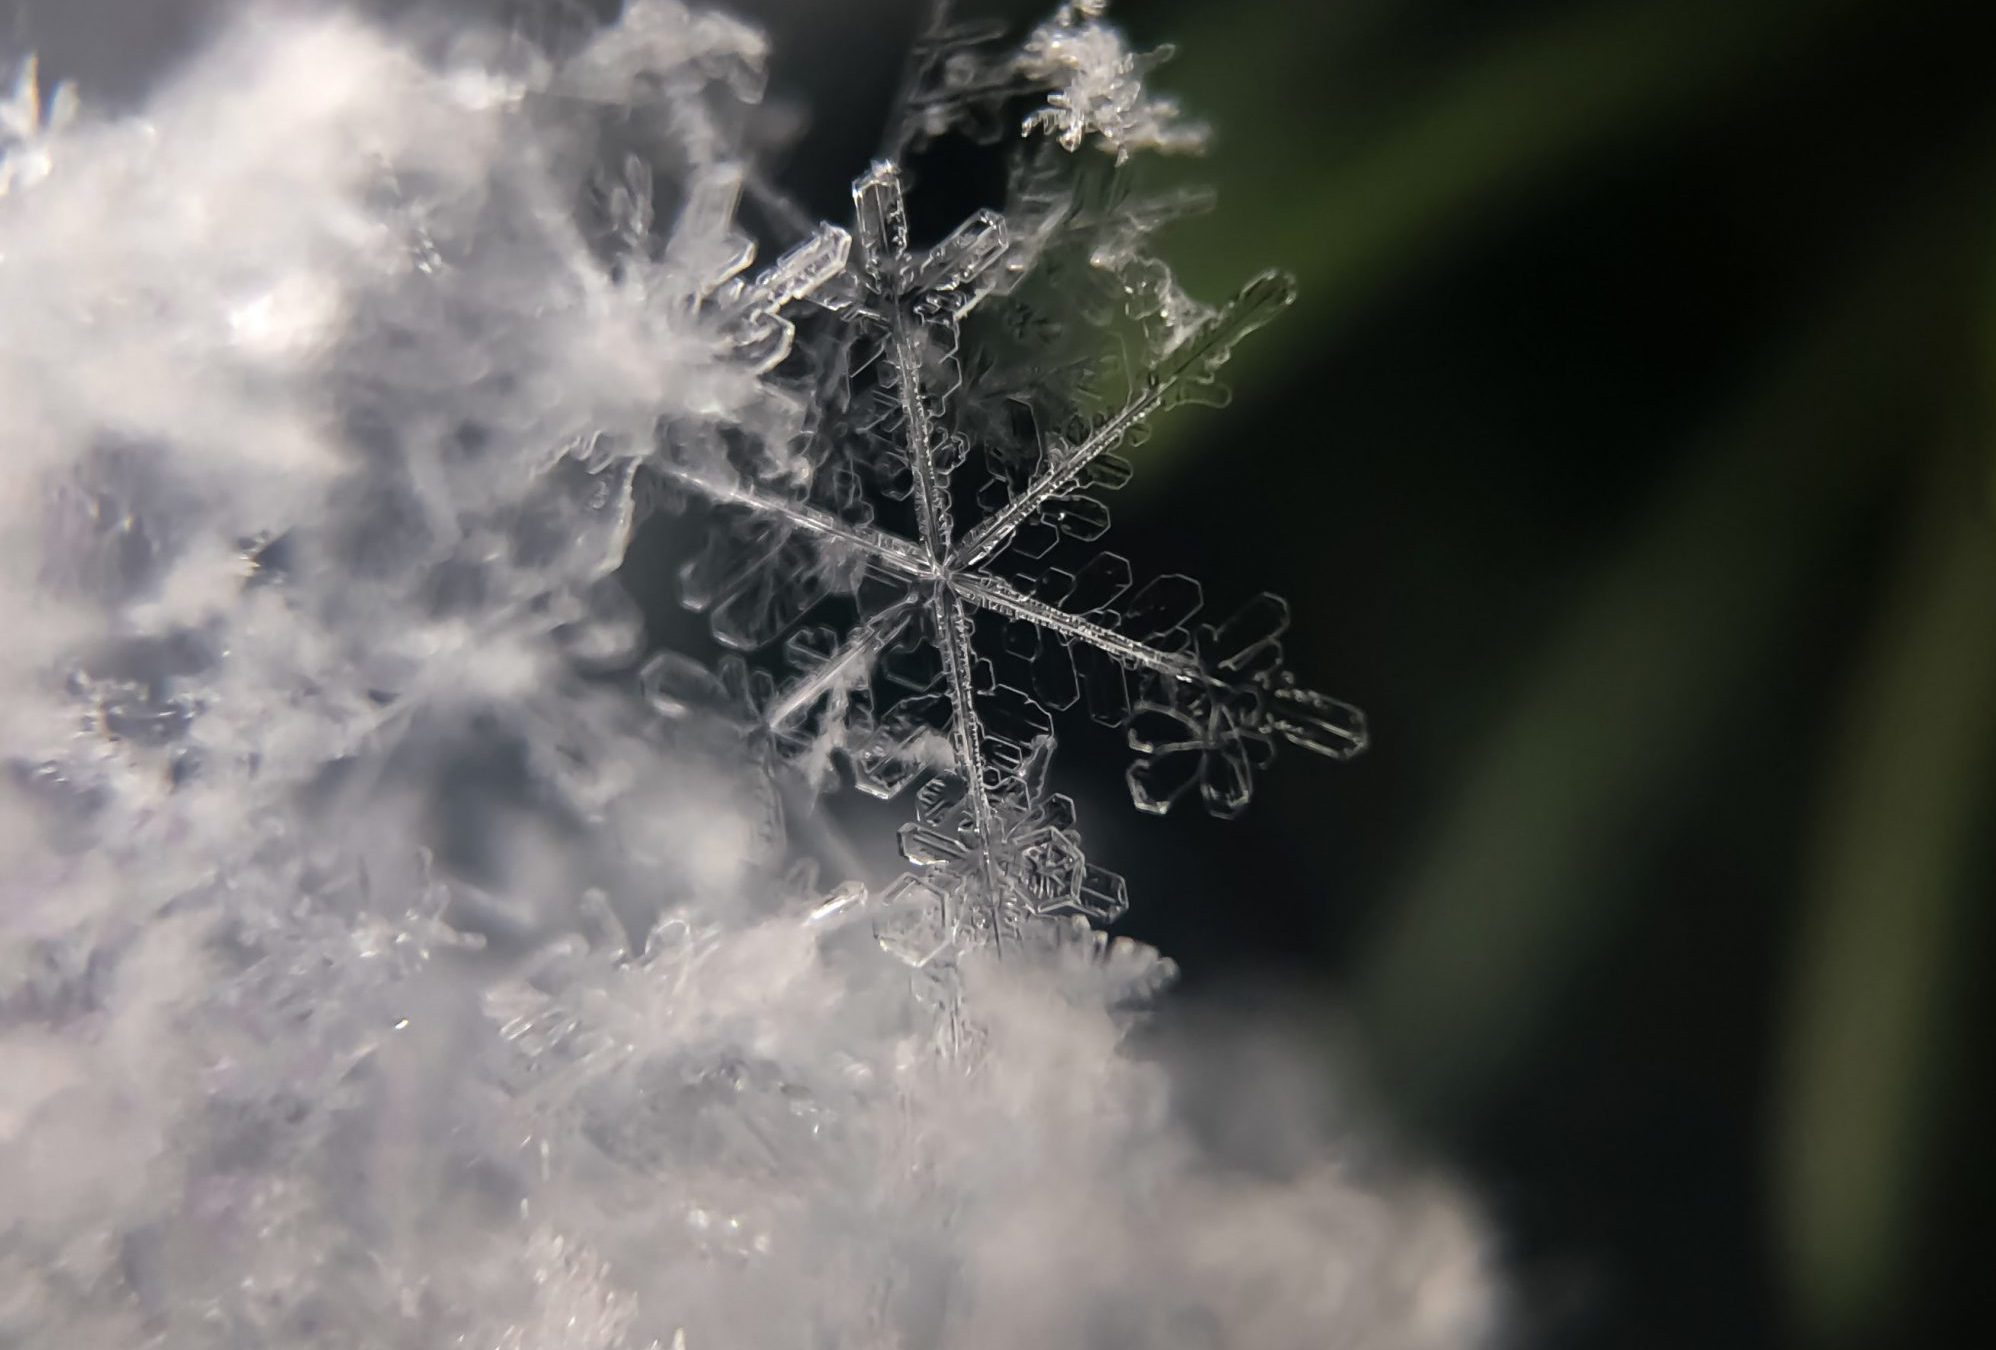
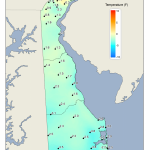
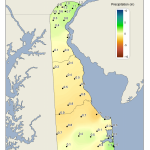
Data from the Delaware Environmental Observing System (DEOS) show that temperatures were uniformly cold across the State, with many locations seeing negative departures of greater than 4o F, especially in Kent and New Castle Counties (Figure 3). A significant snowfall event took place across Delaware on January 25th, dropping over 6 inches of snow across much of the northern one-half of the State (Figure 4).
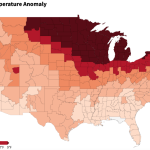
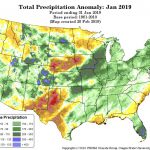
National Anomalies
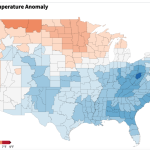
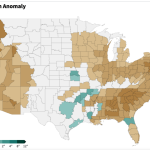
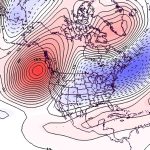
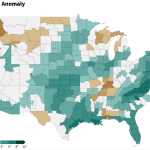
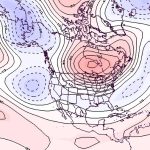
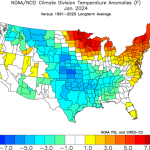
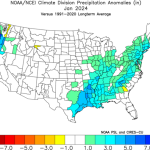
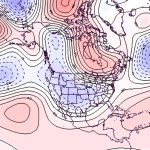
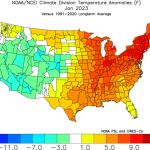
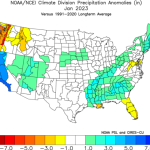
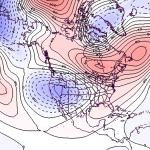
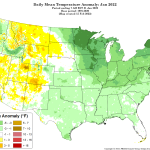
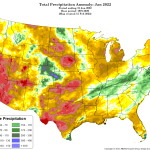
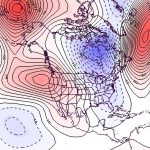
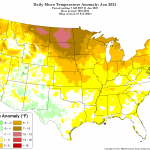
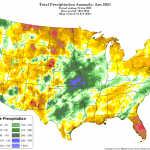
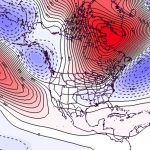
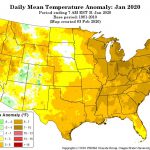
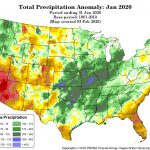
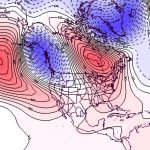
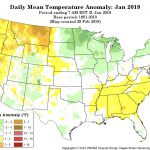
Temperatures were below normal across much of the eastern portions of the United States, except for northern New England (Figure 5), while the western United States saw above normal temperatures, with portions of Montana and Wyoming seeing positive temperature departures more than 9o F above normal. Precipitation was generally below normal along both the Atlantic and Pacific Coasts (Figure 6), while the central portion of the country had near or just above normal precipitation. The 500 hPa height pattern for January showed an anomalous jet stream trough covering the eastern one-half of the United States (Figure 7), and a jet stream ridge along the Pacific Coast contributing to the temperature anomalies across those regions.
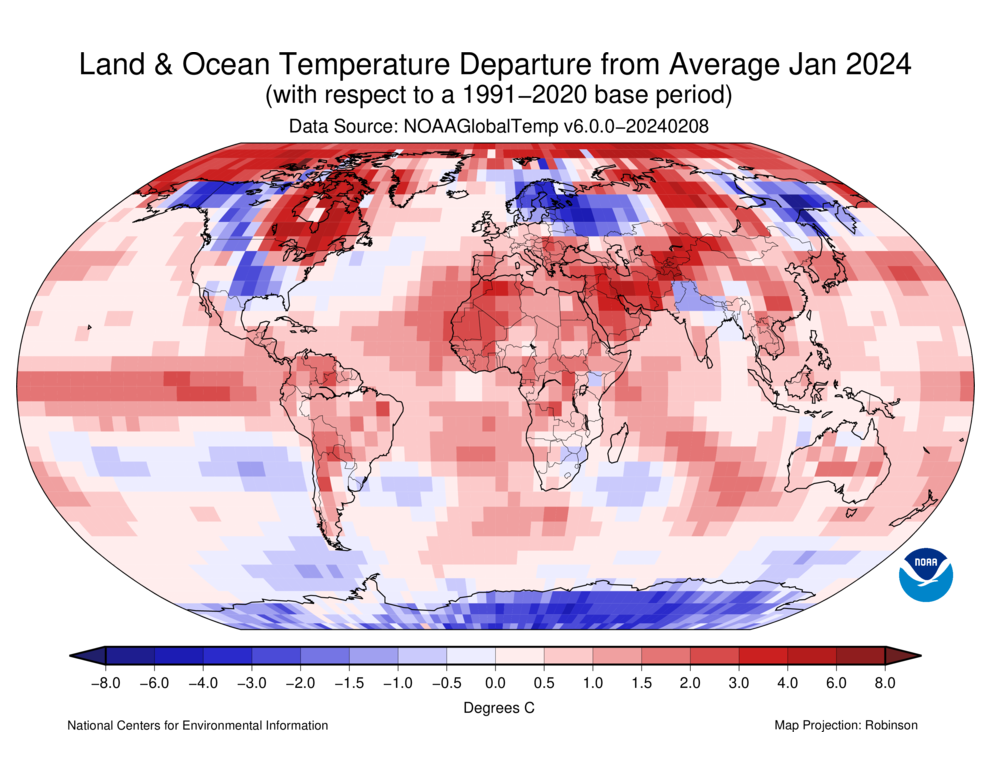
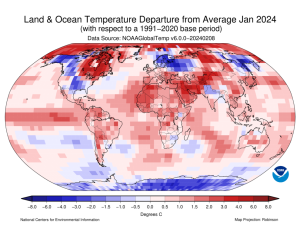
Global Anomalies
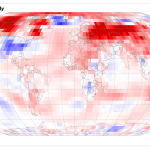
January 2026 ranked as the 5th warmest January on record for the globe since 1850. Global temperatures were 2.02o F above the 1901-2000 mean. Particular warmth was found across much of the Arctic, with very cold conditions stretching from eastern Europe across much of Asia (Figure 8).
-
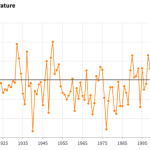
- Figure 1. Delaware statewide mean January temperature (degrees F) 1895-2026. The black line indicates the 1991-2020 normal (NOAA, NCEI, Climate at a Glance: Statewide Time Series).
-
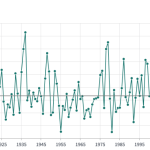
- Figure 2. Delaware statewide January precipitation (inches) 1895-2026. The Black line indicates the 1991-2020 normal (NOAA, NCEI, Climate at a Glance: Statewide Time Series).
-
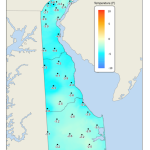
- Figure 3. January 2026 average temperature departures (degrees F) from the 1991-2020 mean based upon DEOS station data.
-
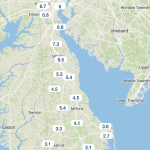
- Figure 4. January 25th, 2026 snowfall totals (inches) based upon DEOS station data.
-
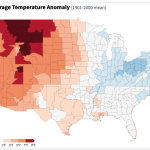
- Figure 5. United States climate division temperature anomalies (oF) for January 2026 (NOAA, NCEI, Climate at a Glance: Divisional Mapping).
-
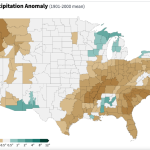
- Figure 6. United States climate division precipitation anomalies (inches) for January 2026 (NOAA, NCEI, Climate at a Glance: Divisional Mapping).
-
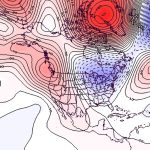
- Figure 7. 500 hPa geopotential height anomalies for January 2026. Negative (blue) anomalies indicate the presence of an anomalous jet stream trough while positive (red) height anomalies indicate the presence of an anomalous jet stream ridge.
-
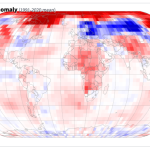
- Figure 8. Global temperature anomalies (degrees C) for January 2026 (NOAA, NCEI, Climate at a Glance: Global Mapping).