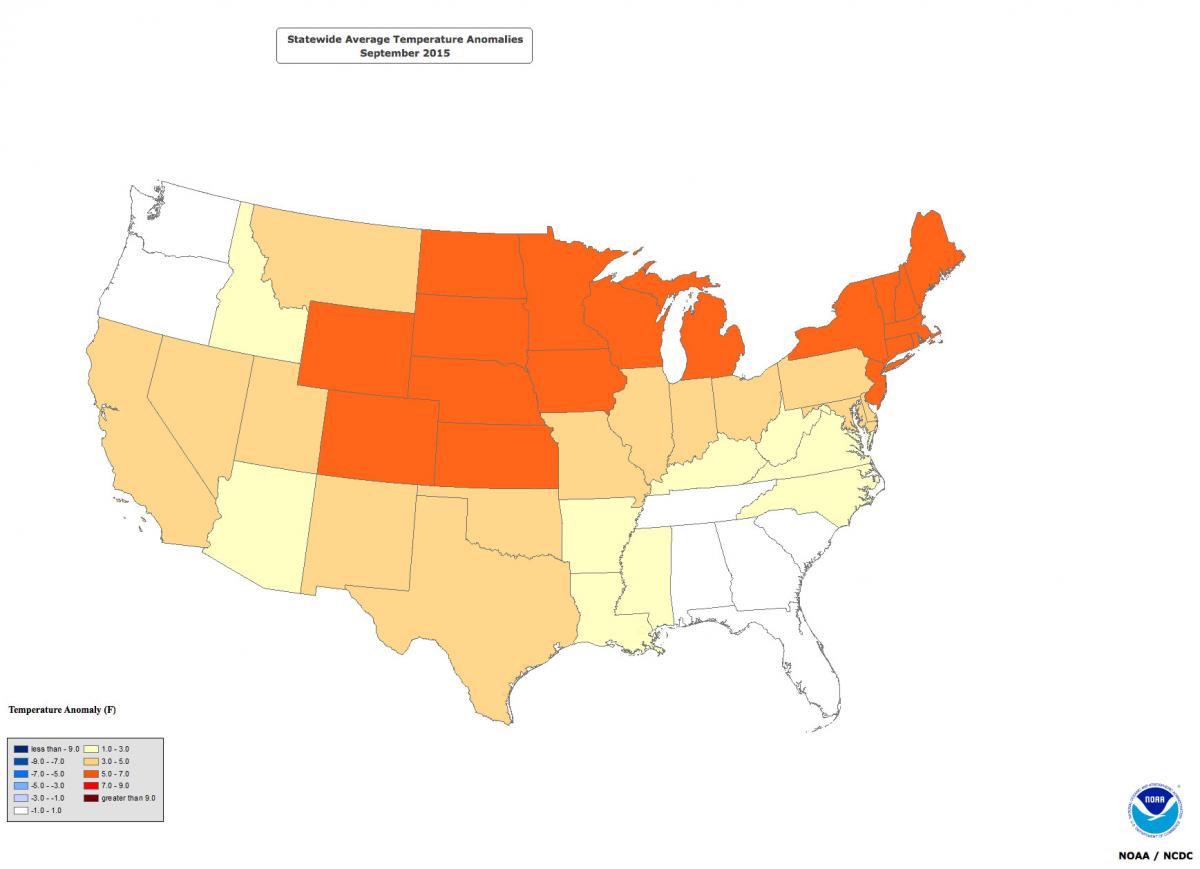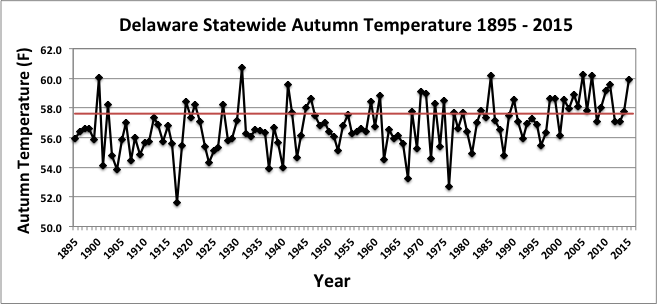
Autumn Temperatures
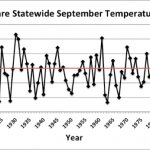
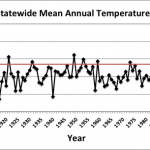
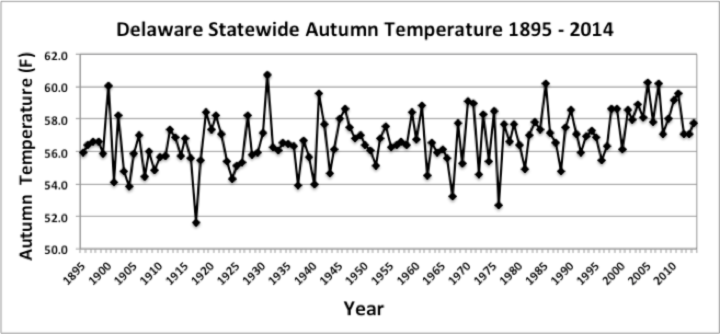
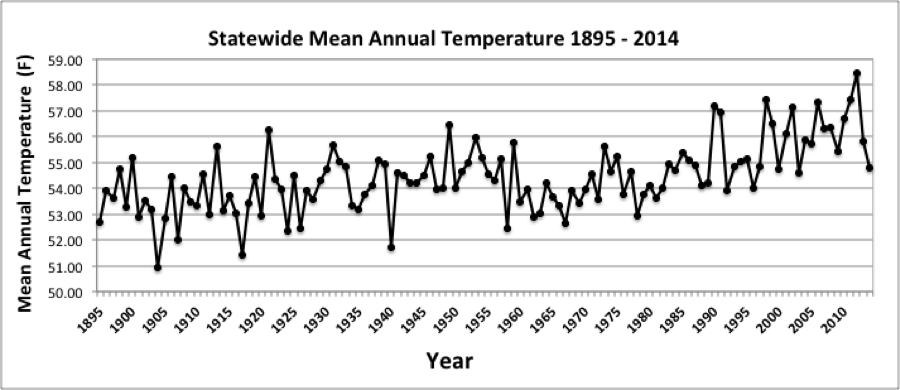
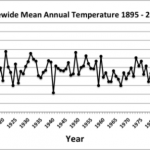
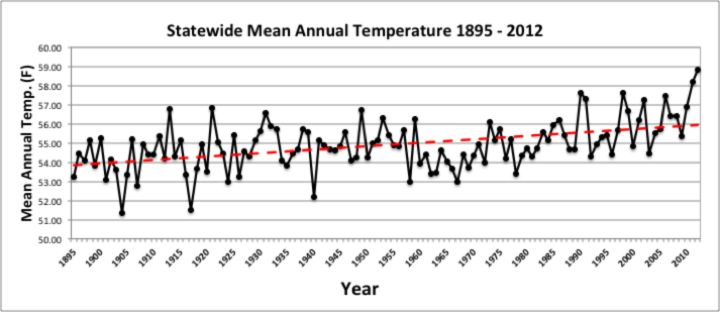
Preliminary data indicates that temperatures were significantly above the 30-year normal during the autumn season. The statewide mean autumn temperature of 60.3°F was 2.7°F above the 1981-2010 mean value of 57.6°F (Figure 1). Autumn 2016 was tied with the 2005 season as the 2nd warmest autumn since records began in 1895.
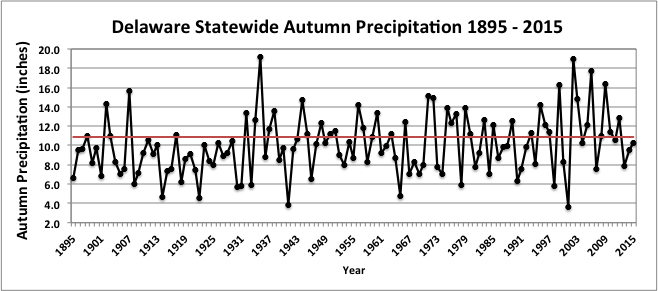
Autumn Precipitation
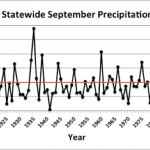
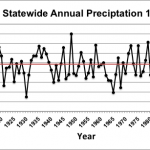
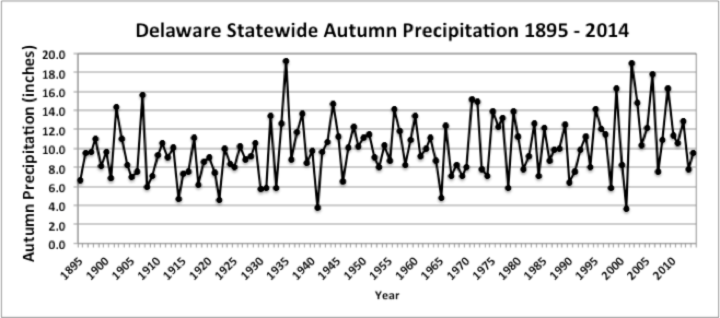
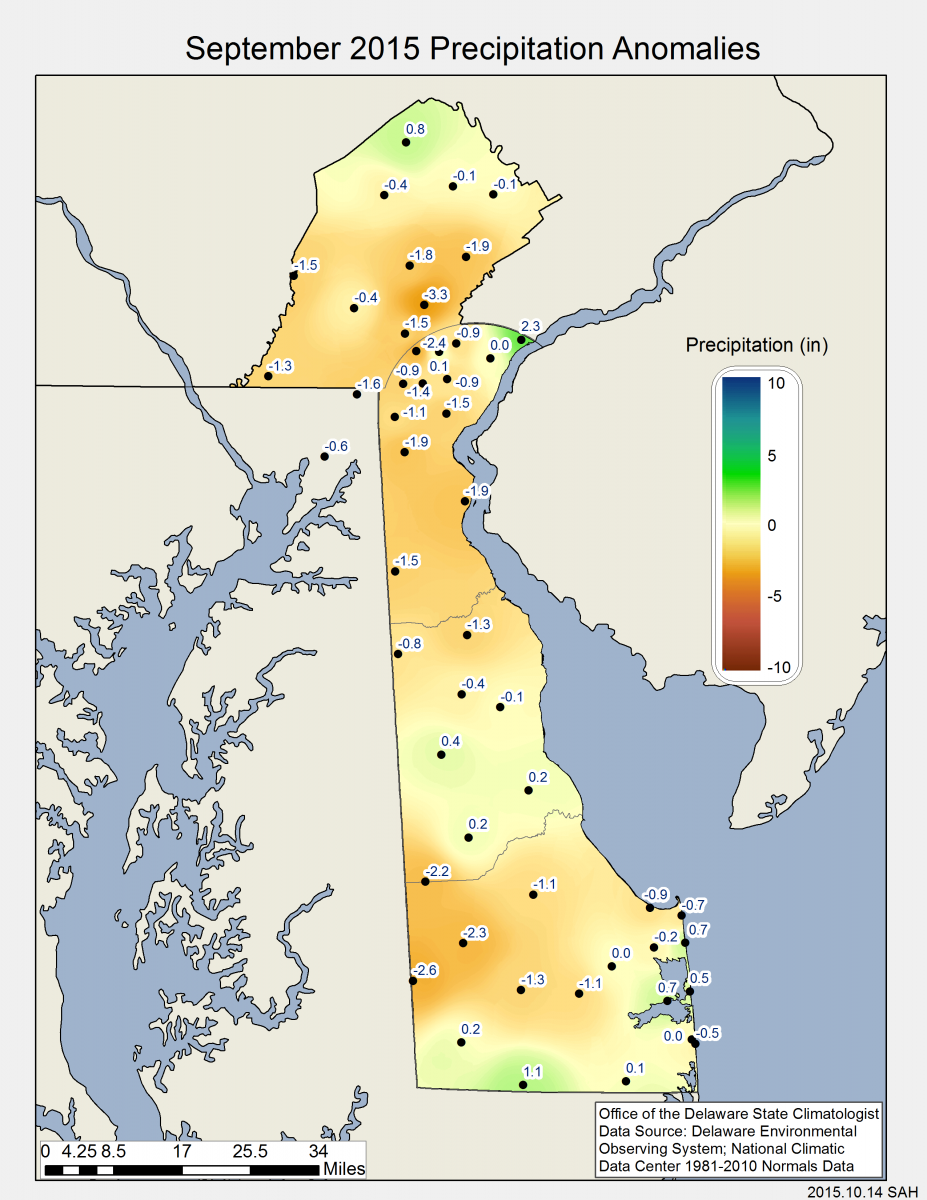
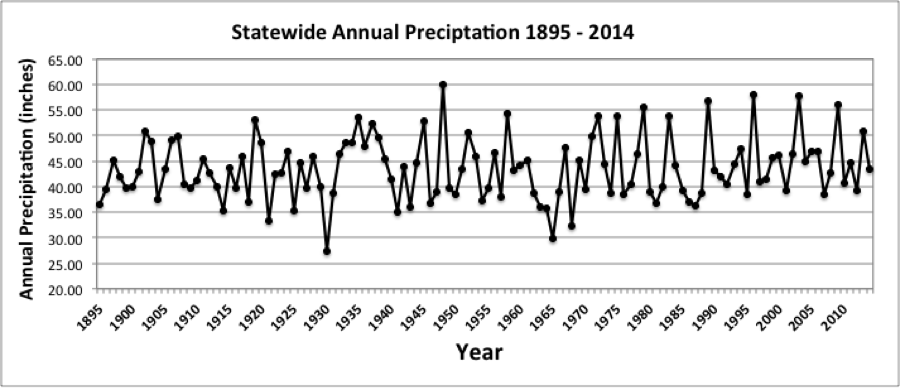
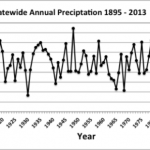
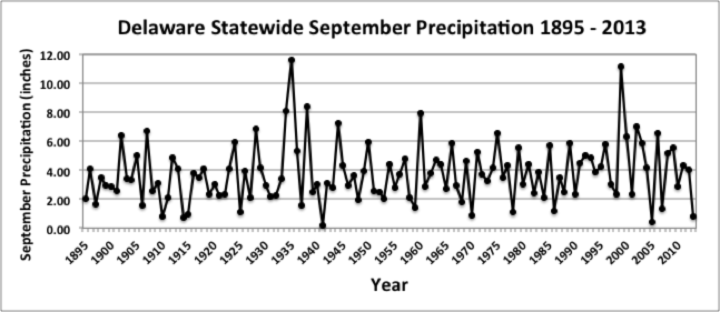
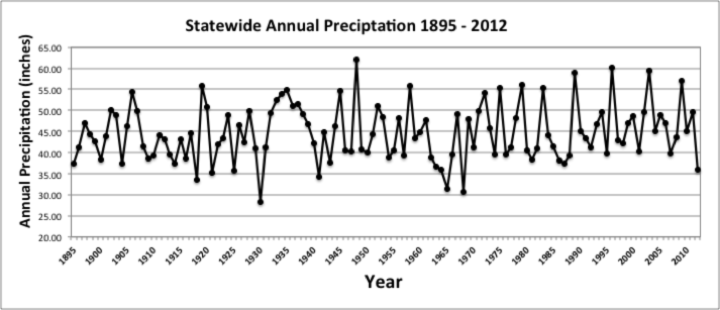
The statewide mean precipitation of 13.23 inches was 2.40 inches above the 1981-2010 normal of 10.83 inches (Figure 2). However, much of the autumn total fell during September, when 9.43 inches of precipitation fell across the State, the 3rd wettest September total on record.
Statewide Spatial Averages
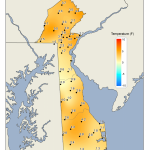
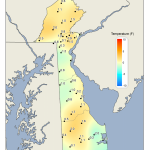
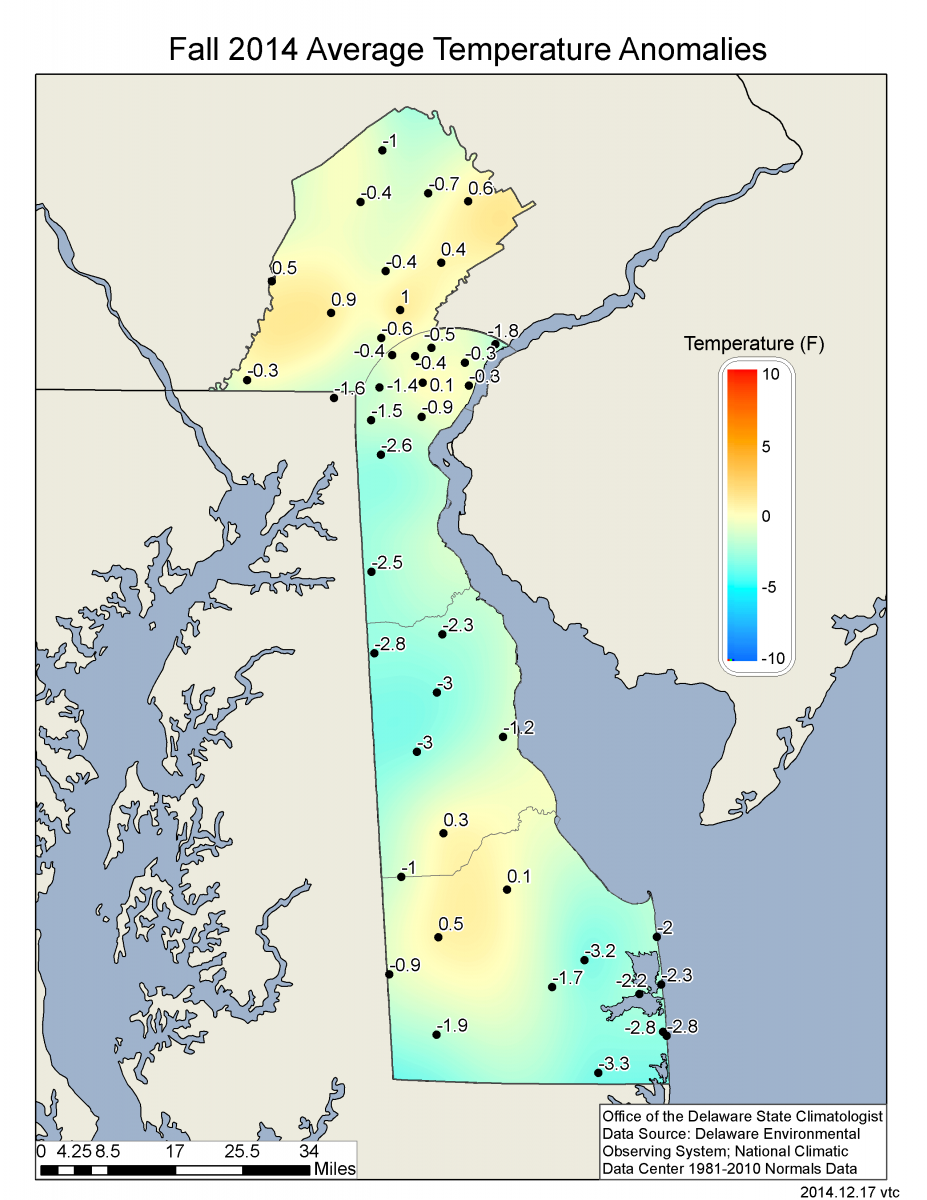
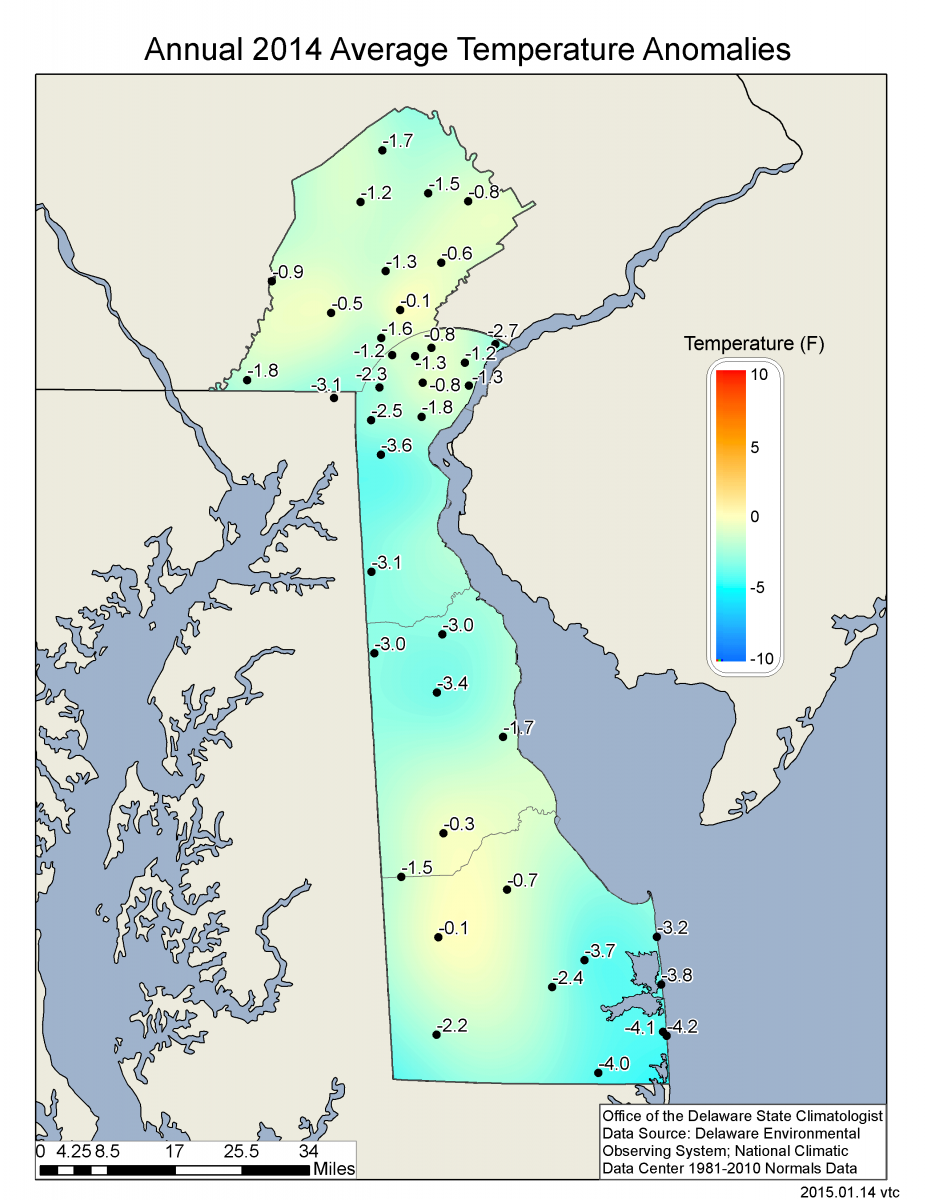
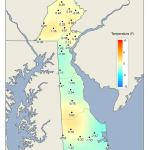
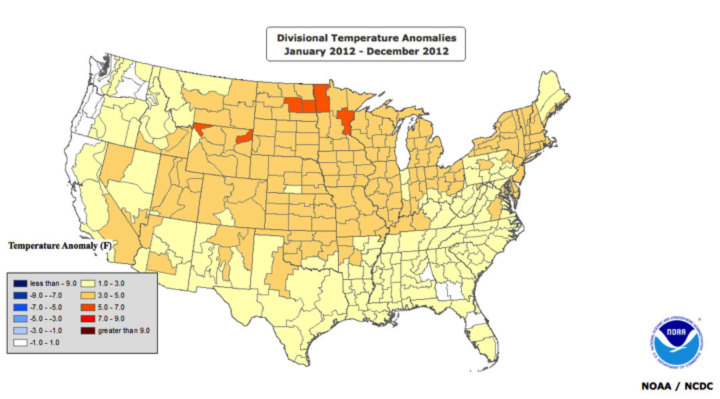
Data from the Delaware Environmental Observing System (DEOS) show that autumn temperatures were much above normal across northern New Castle County and Chester County, PA, along with southern portions of Kent and northern Sussex counties (Figure 3).
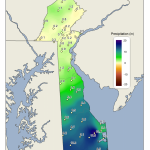
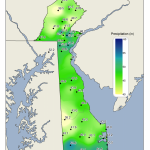
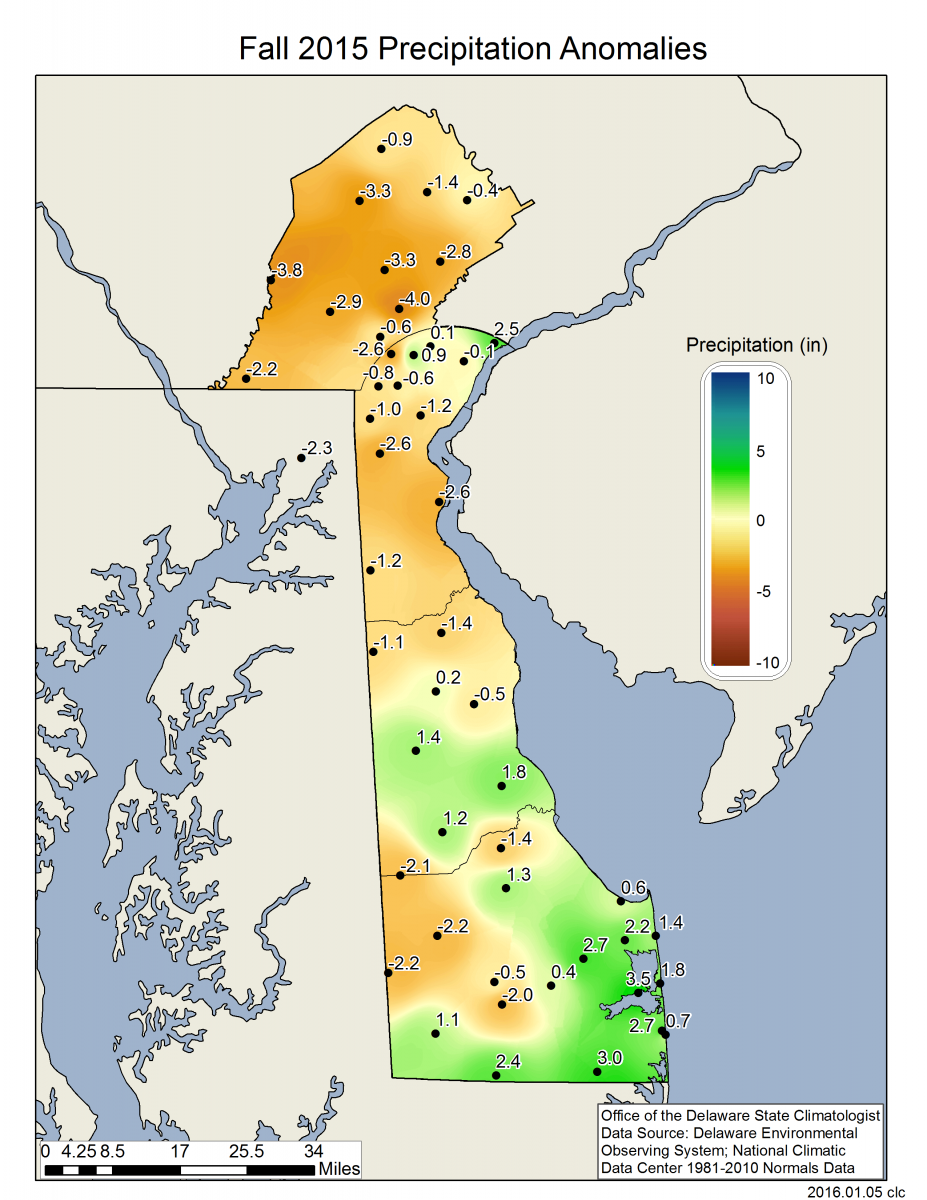
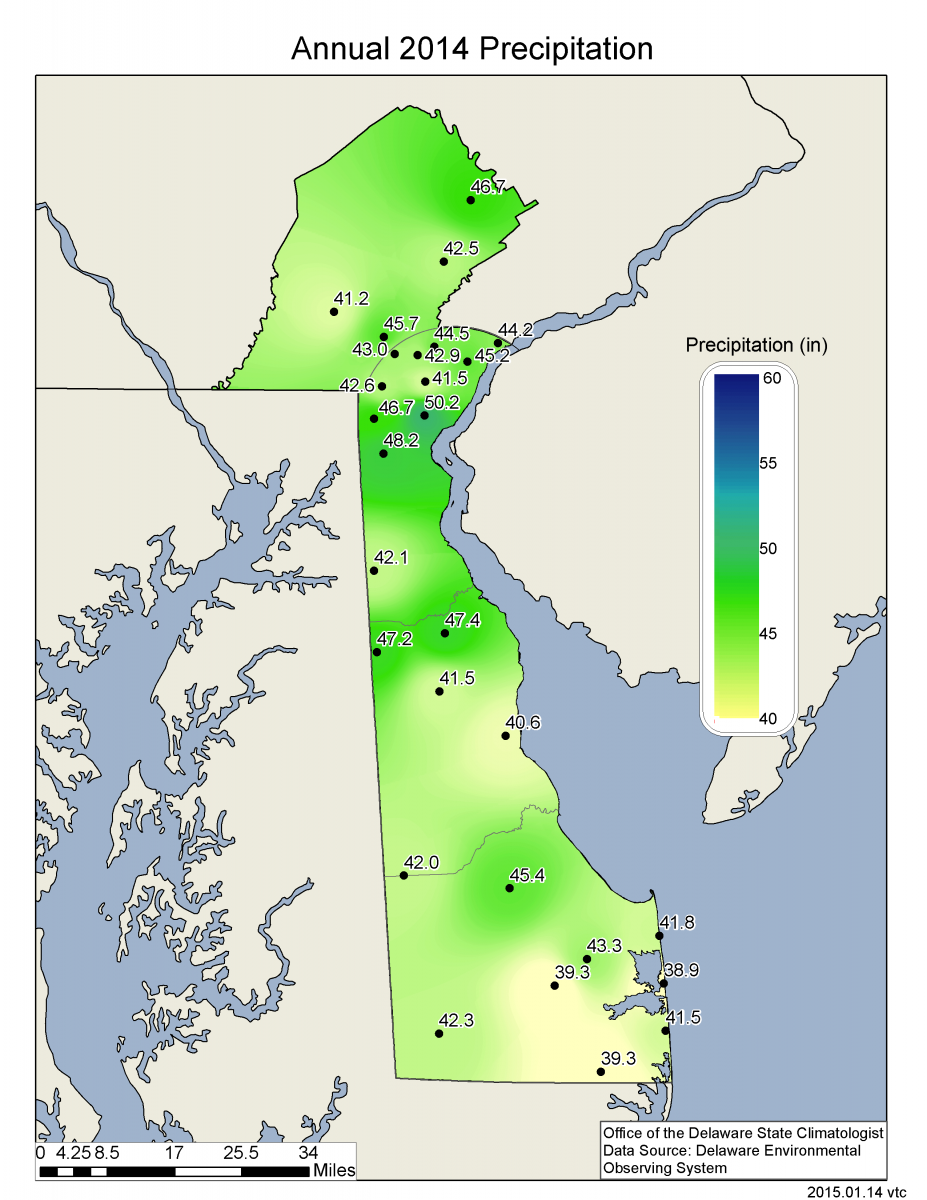
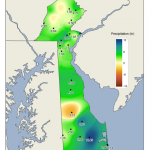
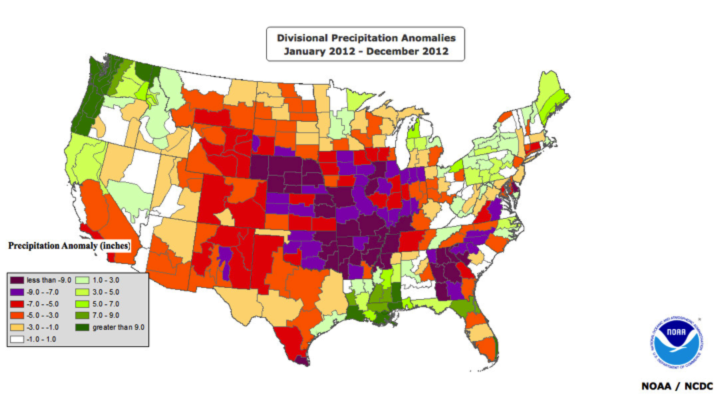
Autumn precipitation varied appreciably across the State depending upon location. Very dry conditions were especially apparent across extreme northern Delaware and Chester County, PA (Figure 4), while southern Delaware saw much above normal precipitation during the autumn Season.
-
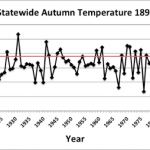
- Figure 1. Delaware statewide mean autumn temperature (°F) 1895-2016. Red line indicates 1981-2010 normal.
-
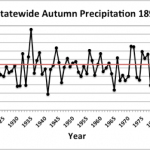
- Figure 2. Delaware statewide autumn precipitation (inches) 1895-2016. Red line indicates 1981-2010 normal.
-
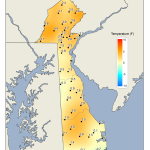
- Figure 3. Autumn 2016 average temperature departures (°F) from the 1981-2010 mean based upon DEOS station data.
-
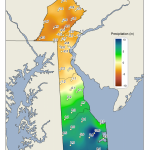
- Figure 4. Autumn 2016 precipitation departures (inches) from the 1981-2010 mean based upon DEOS station data.