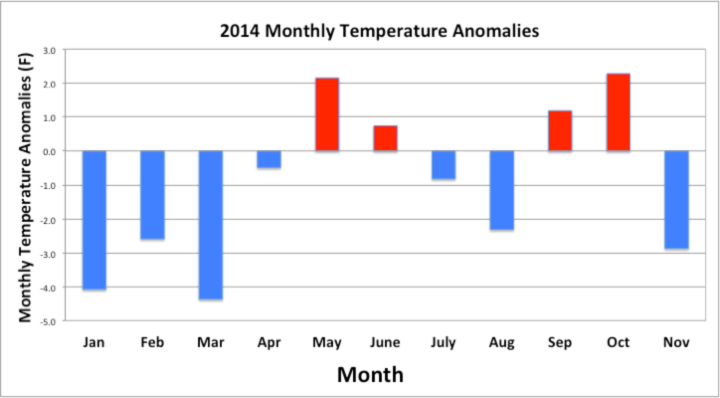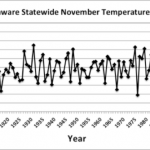
November Temperatures
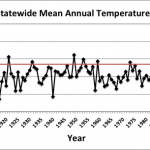
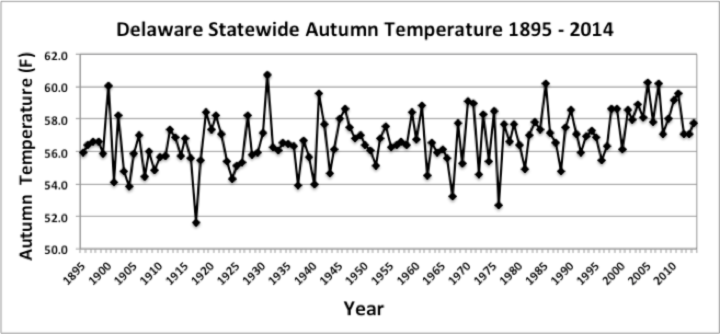
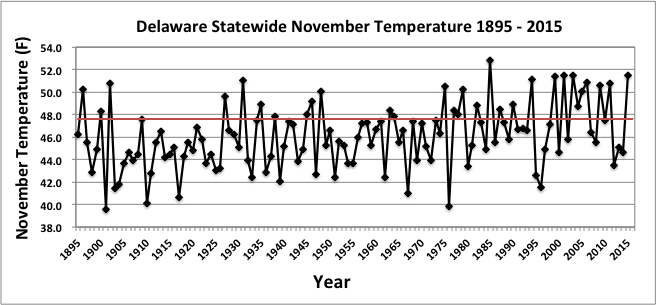
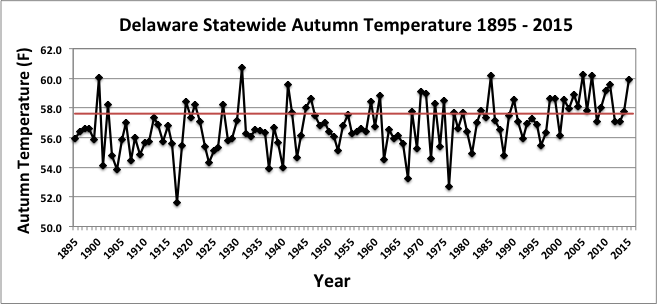
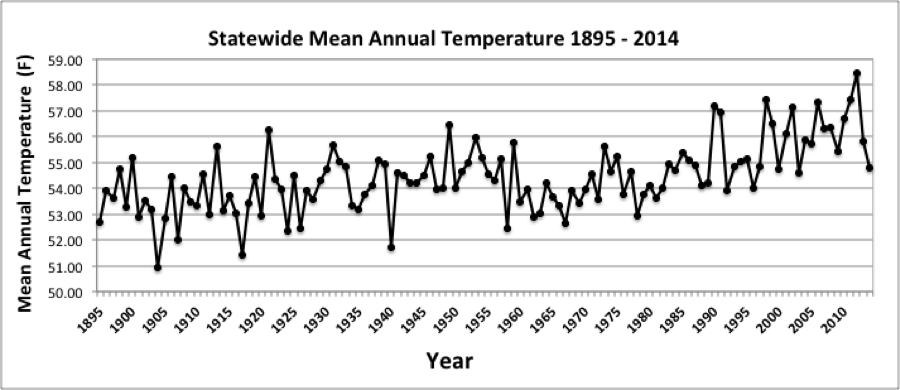
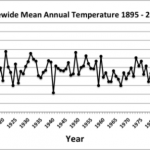
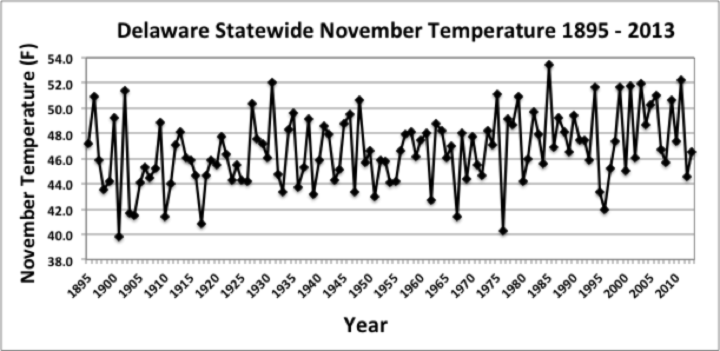
Preliminary data indicates that the statewide average temperature in November was 48.7°F, 1.1°F above the 1981-2010 normal of 47.6°F (Figure 1). November was the fifth month in a row with temperatures appreciably above normal across the First State.
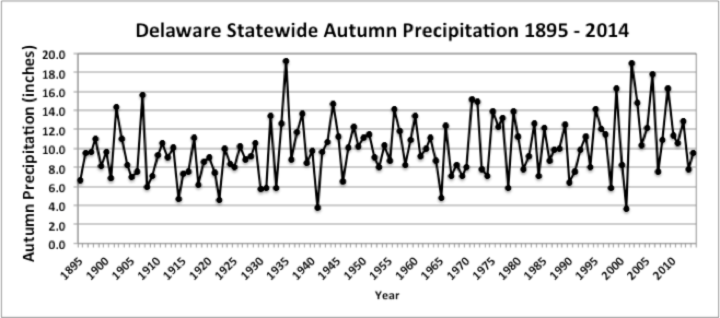
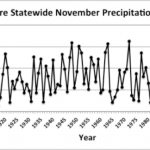
November Precipitation
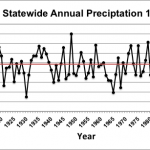
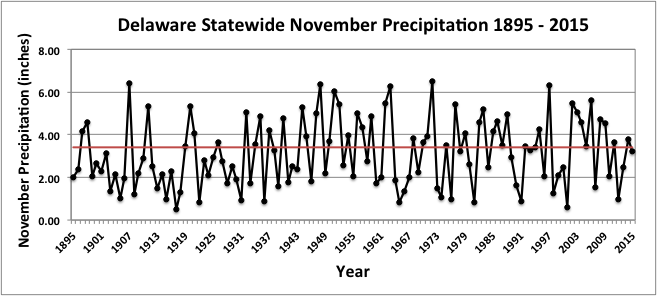
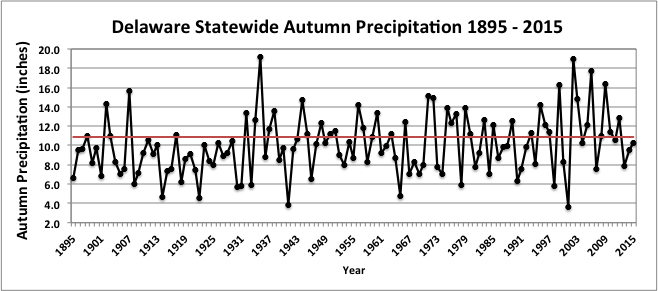
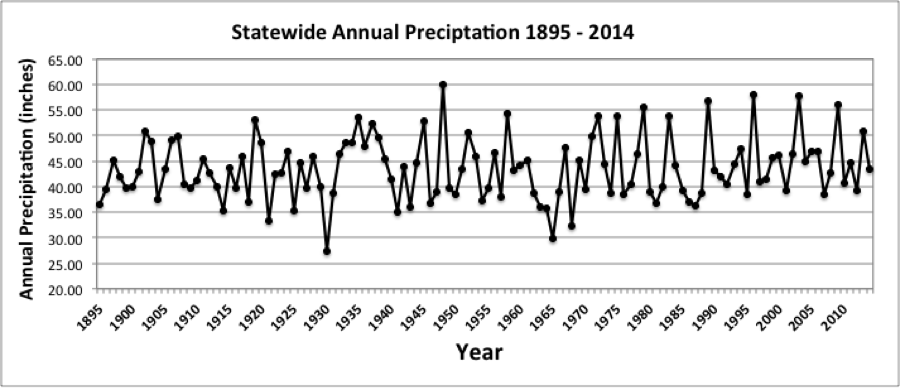
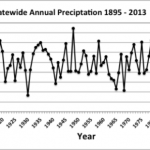
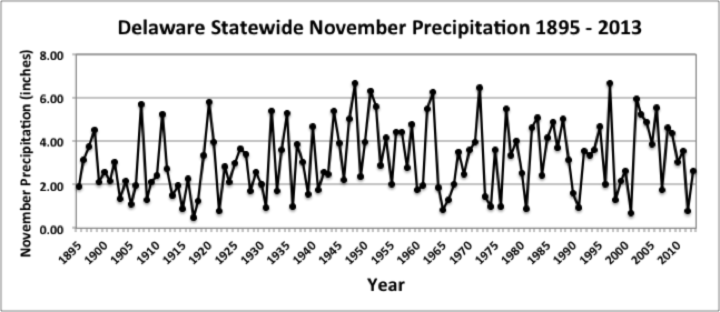
Delaware’s statewide precipitation for November 2016 averaged 0.91 inches, 2.49 inches below the 1981-2010 mean of 3.40 inches (Figure 2). November 2016 was the 8th driest November since records began in 1895.
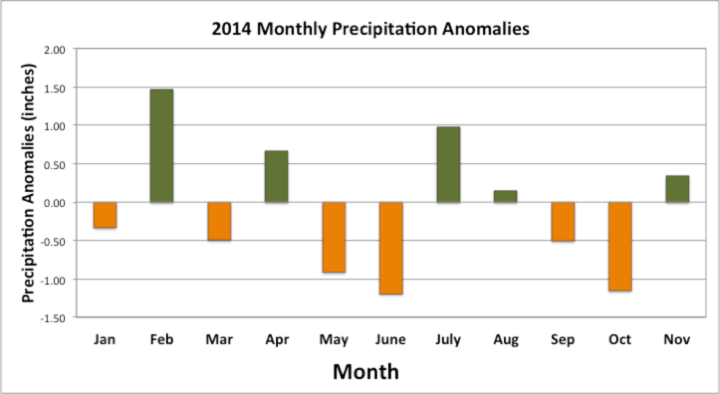
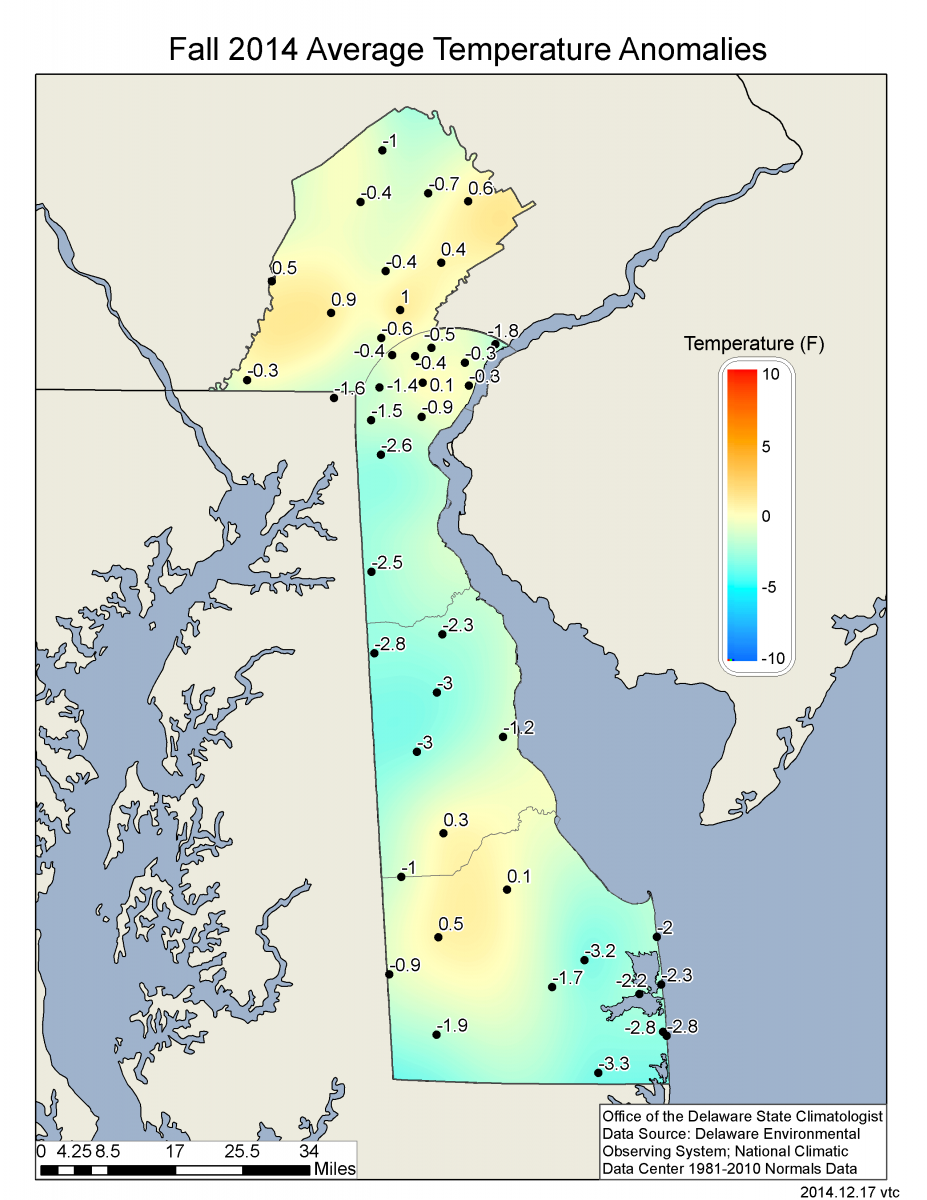
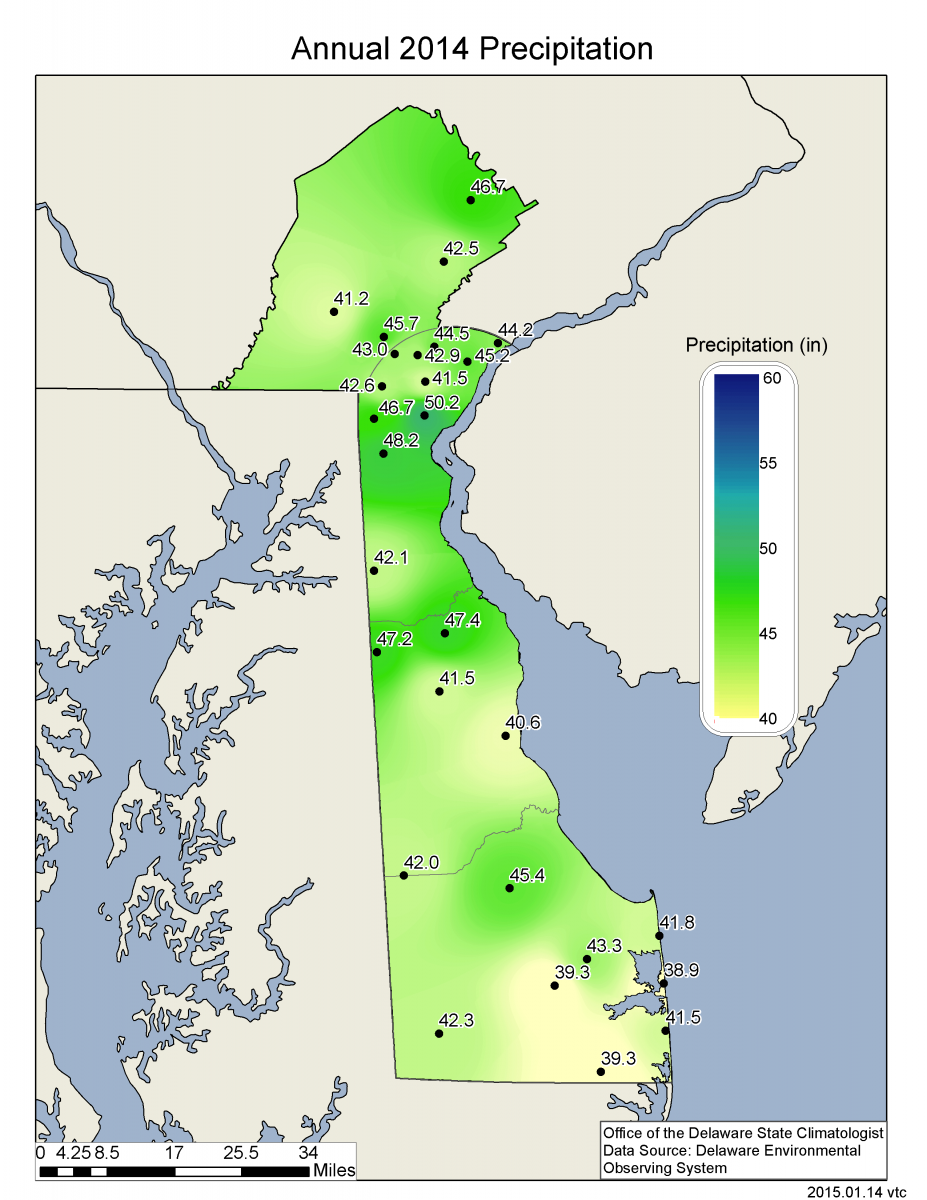
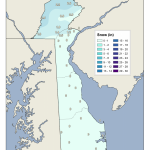
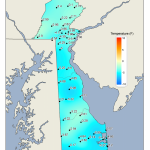
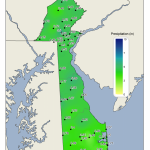
Statewide Spatial Averages
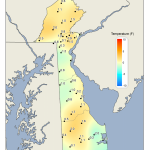
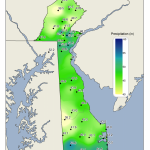
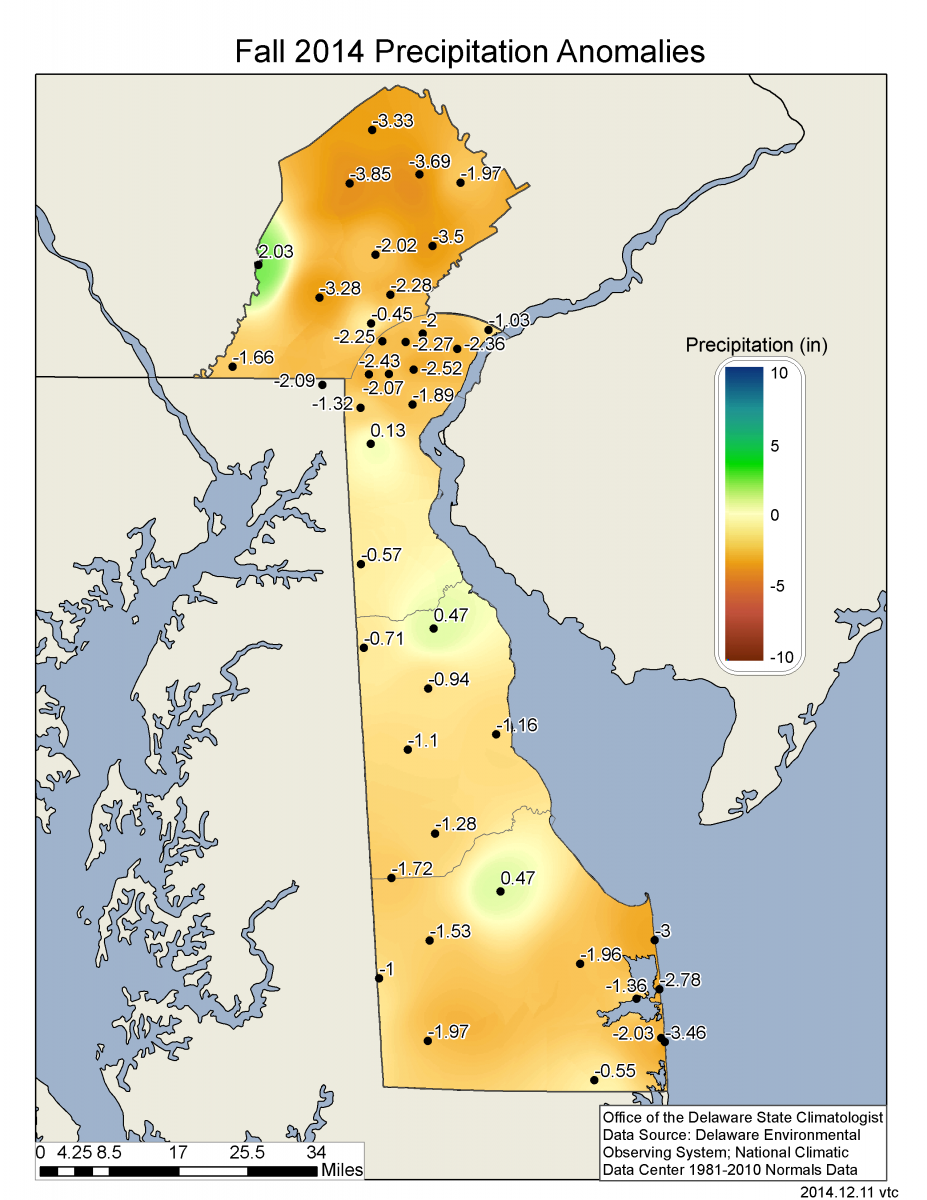
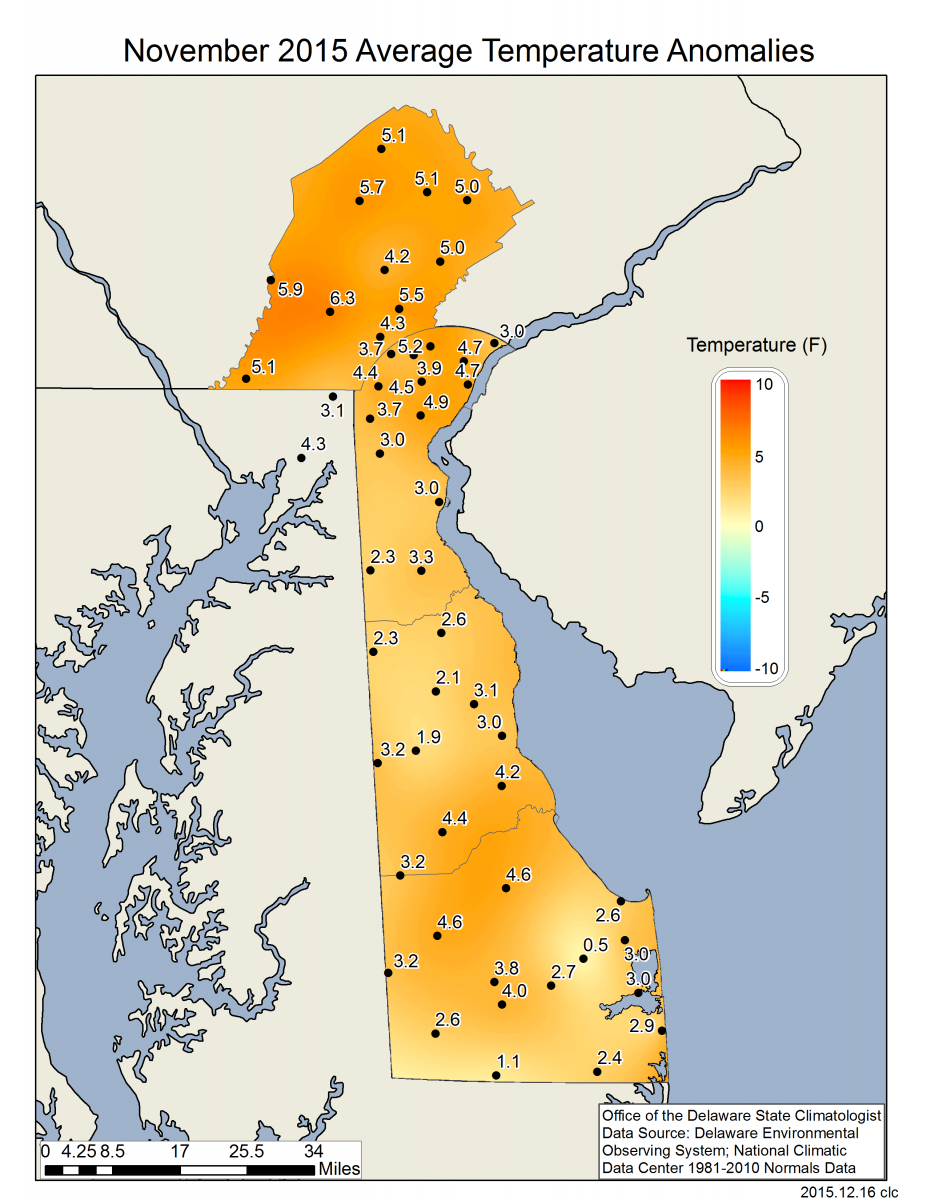
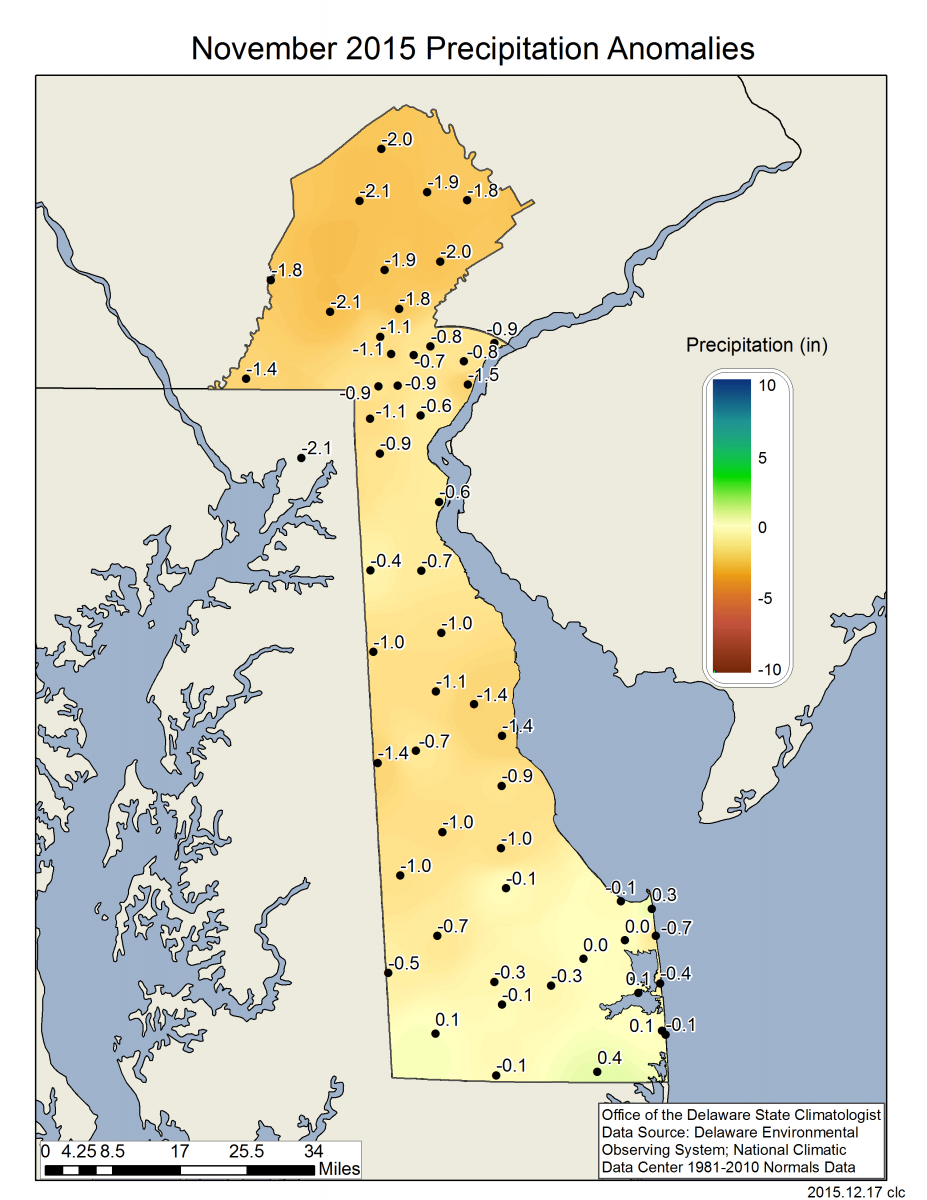
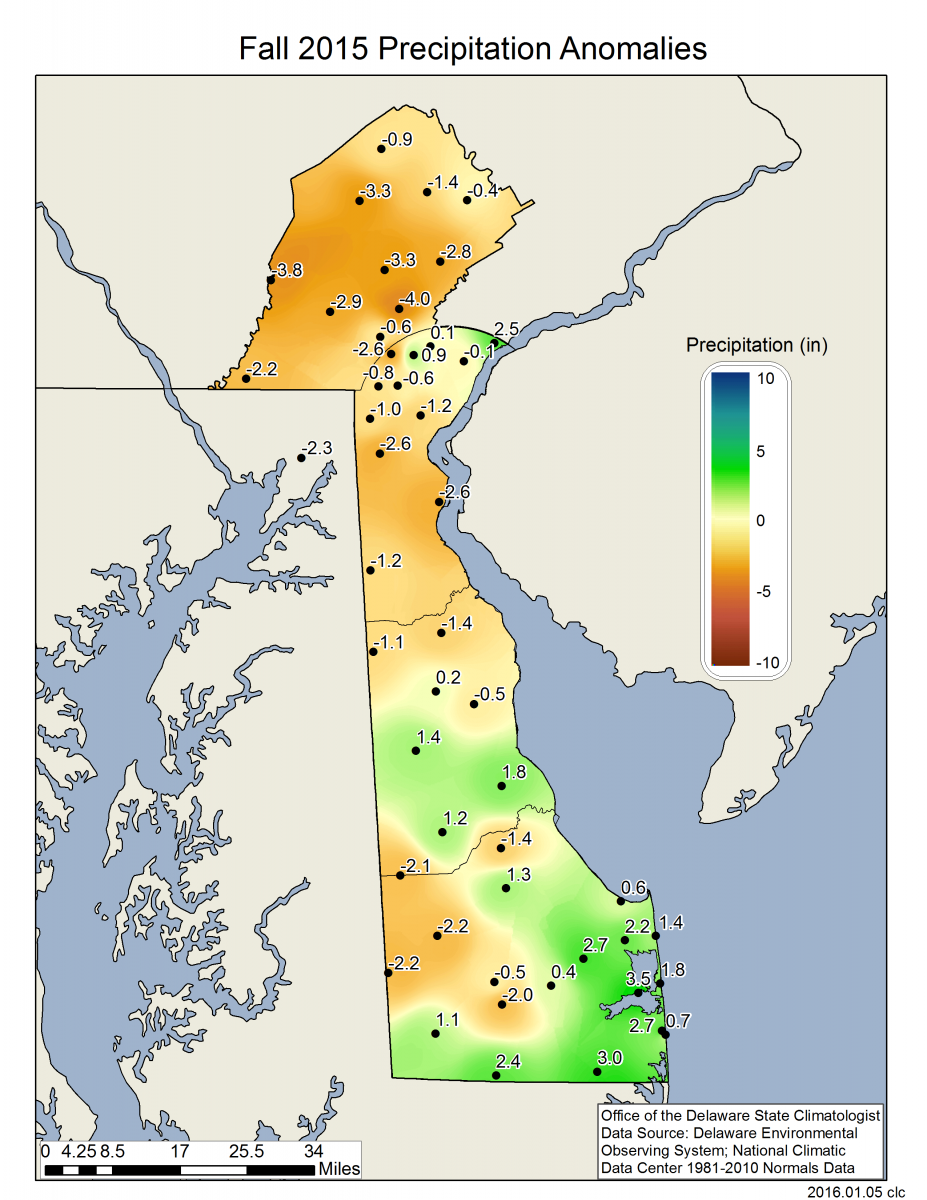
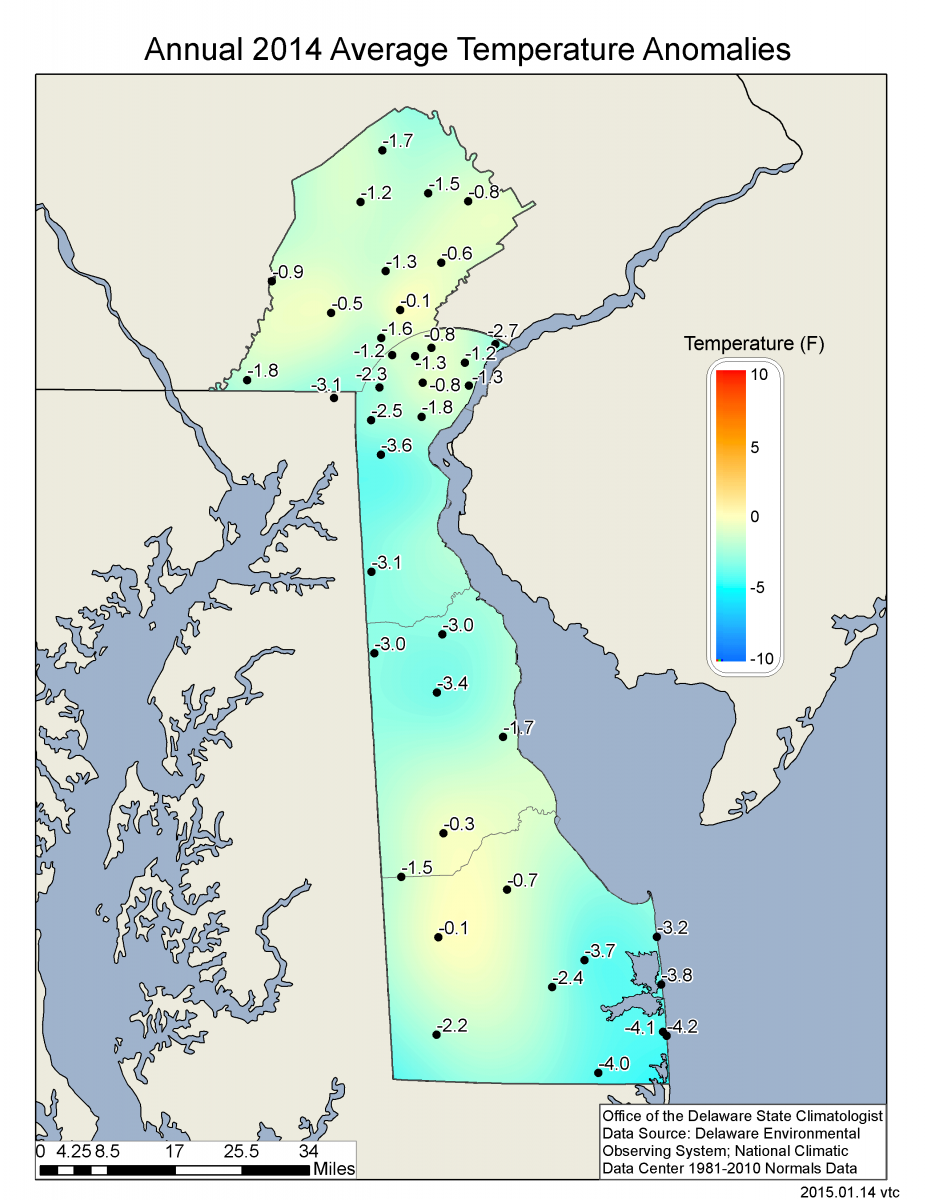
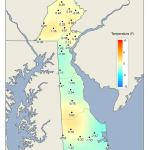
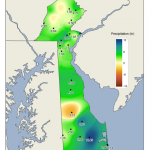
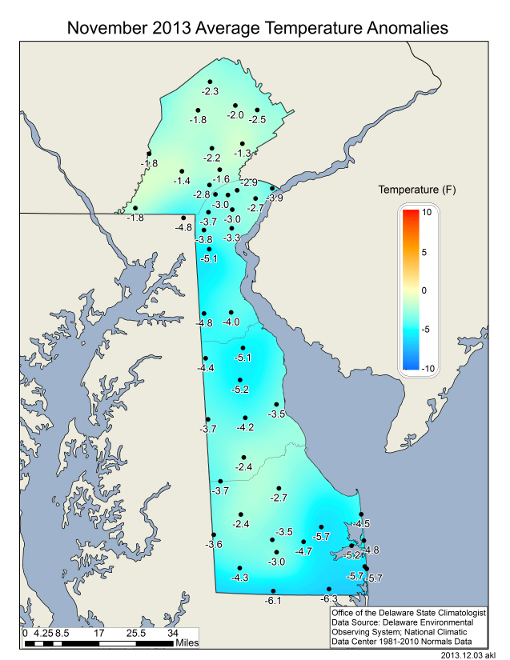
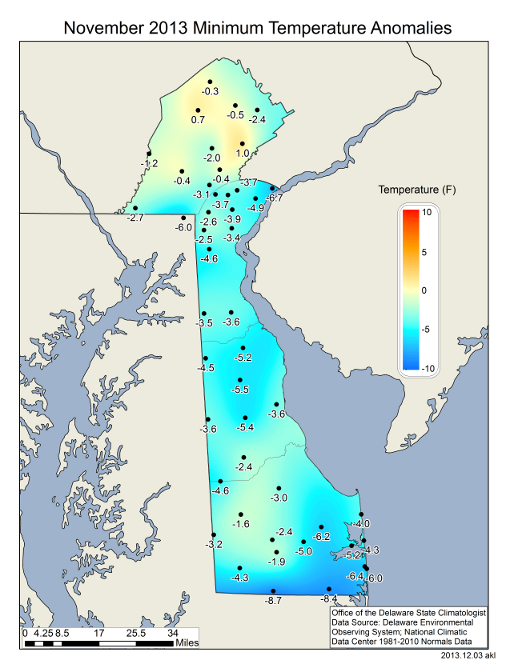
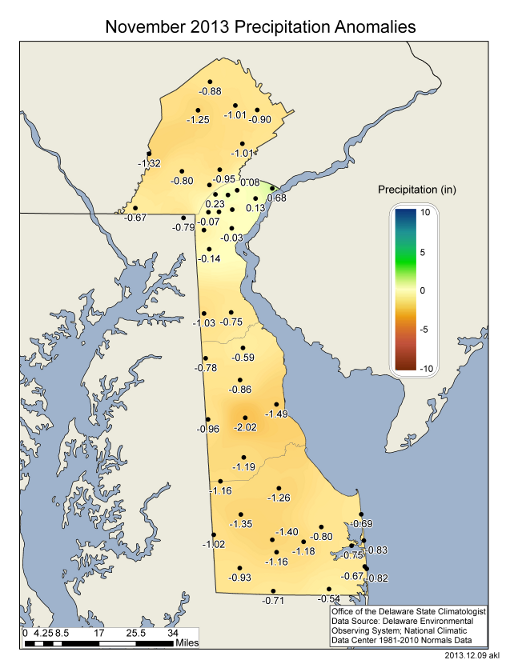
Data from the Delaware Environmental Observing System (DEOS) shows that temperatures were well above normal across extreme northern Delaware and Chester County, PA during November (Figure 3). Temperatures were well above normal across inland Sussex County as well. Much below normal rainfall was the rule across southern Delaware, with smaller rainfall deficits found in northern Delaware and Chester County, PA (Figure 4).
-
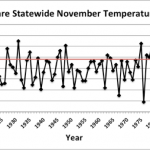
- Figure 1. Delaware statewide mean November temperature (°F) 1895-2016. Red line indicates 1981-2010 normal.
-
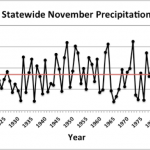
- Figure 2. Delaware statewide November precipitation (inches) 1895-2016. Red line indicates 1981-2010 normal.
-
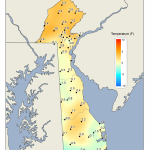
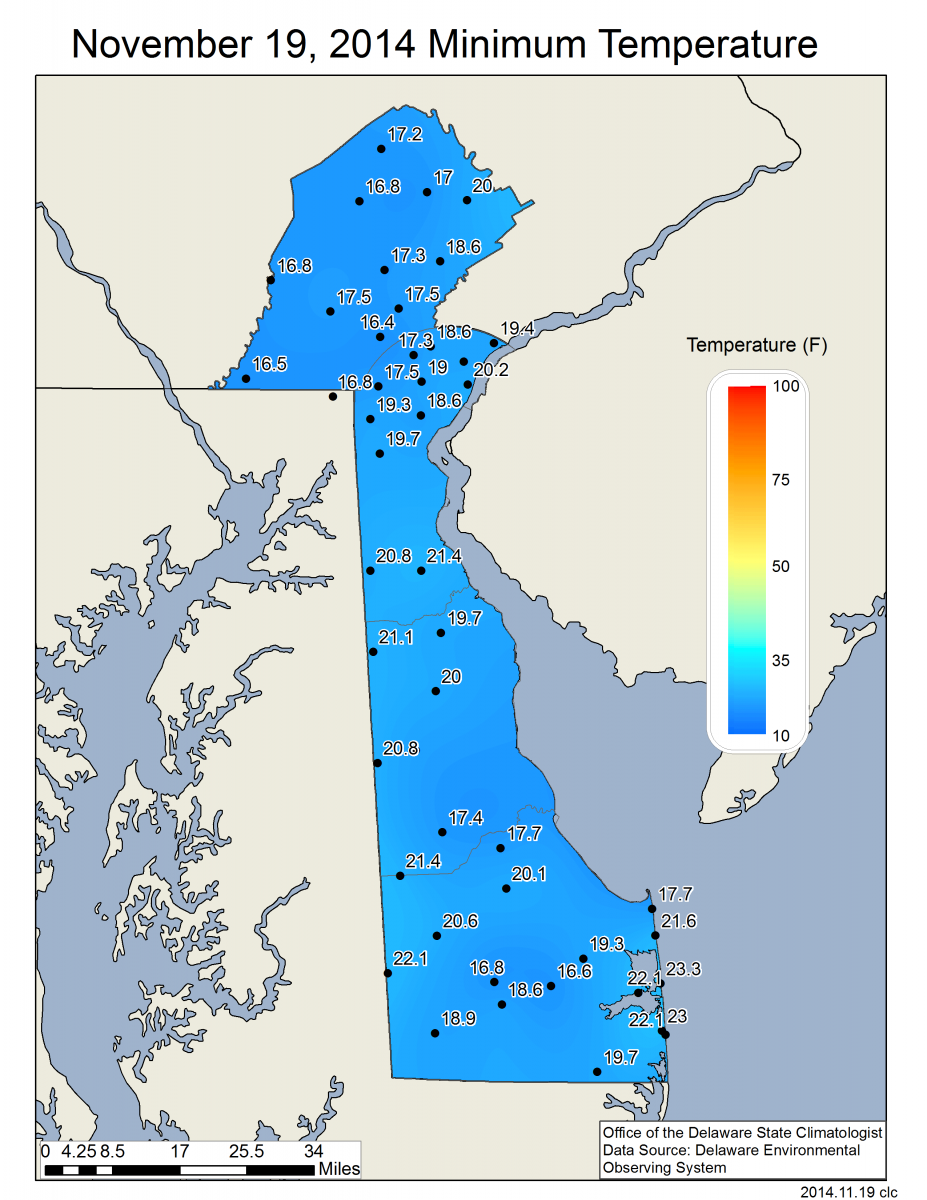
- Figure 3. November 2016 average temperature departures (°F) from the 1981-2010 mean based upon DEOS station data.
-
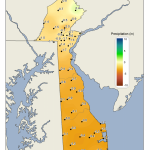
- Figure 4. November 2016 precipitation departures (inches) from the 1981-2010 mean based upon DEOS station data.