March Temperatures
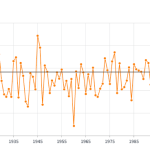
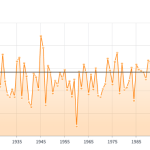
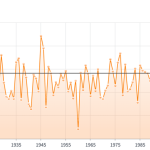
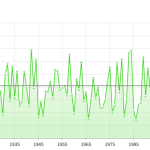
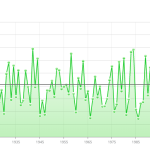
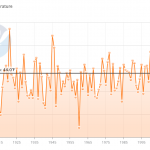
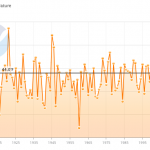
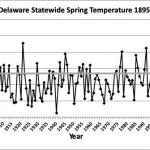
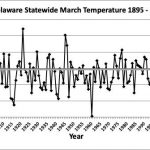
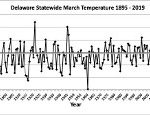
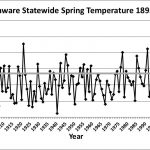
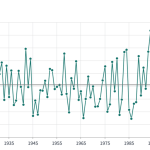
Preliminary data indicates that the statewide average temperature in March was 48.6o F, which is 4.4o F above the 1991-2020 average value of 44.2o F (Figure 1). March 2026 was the 9th warmest March since observations began in 1895. At the Wilmington and Georgetown Airports (Figure 2a and 2b), an early spring warm up from March 8th through the 11th resulted in high temperatures reaching into the 70s and 80s. Although a few cold periods occurred after this early warm up, temperatures generally remained above average resulting in the very warm monthly value.
March Precipitation
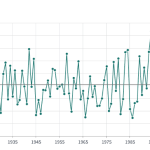
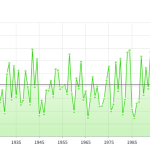
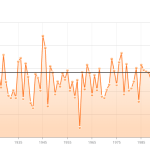
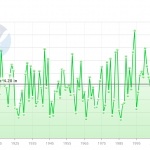
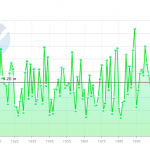
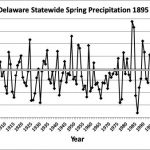
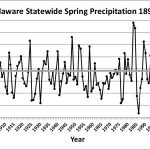
Delaware’s statewide precipitation for March 2026 averaged 2.06 inches, 2.06 inches below the 1991-2020 average of 4.12 inches (Figure 3). March 2026 was the 15th driest March since observations began in 1895. March was also the 8th month in a row with at or below normal precipitation for Delaware.
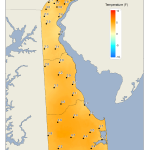
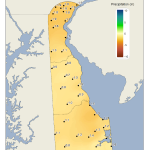
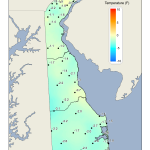
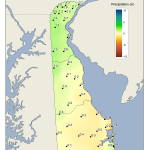
Statewide Spatial Anomalies
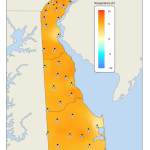
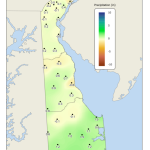
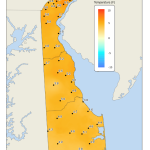
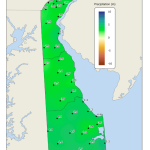
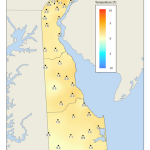
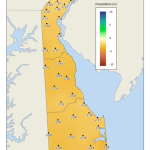
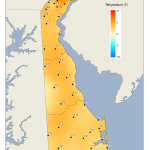
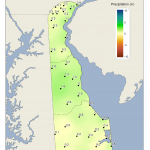
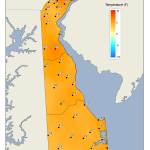
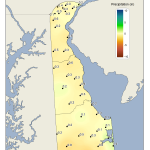
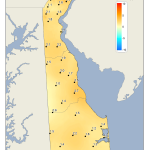
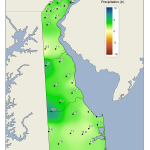
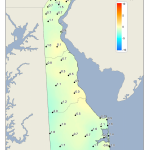
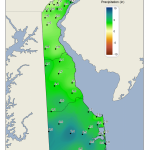
Data from the Delaware Environmental Observing System (DEOS) show that temperatures were uniformly warm across the State, with most locations seeing positive departures of between 4o F and 7o F (Figure 4). Precipitation was below normal across the entire state with most stations seeing negative departures between 1 and 3 inches (Figure 5).
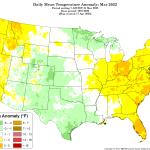
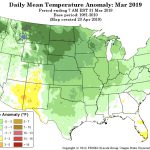
National Anomalies
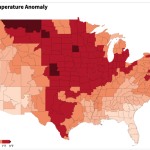
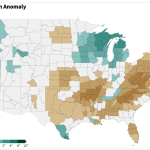
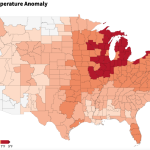
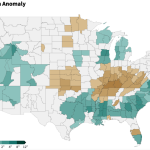
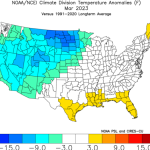
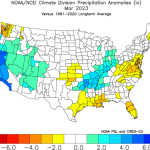
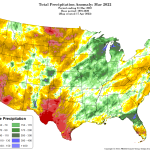
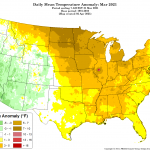
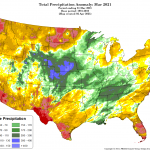
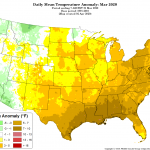
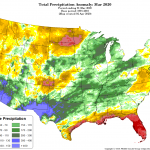
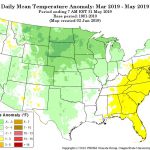
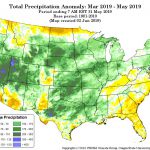
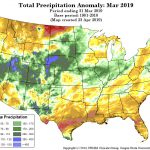
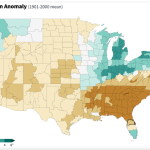
Temperatures were above normal across the entire coterminous United States in March (Figure 6). The core of this country-wide warmth was found across the central Rockies and much of the desert Southwest where positive departures reached over 10o F! Precipitation was generally below normal across the majority of the country (Figure 7), especially across the Southeast and much of California. The Great Lakes, much of the Northeast, and the Pacific Northwest saw above normal precipitation during the month.
Global Anomalies
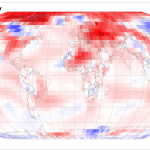
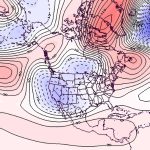
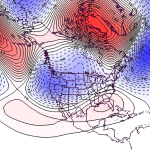
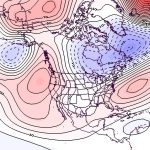
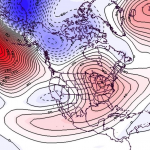
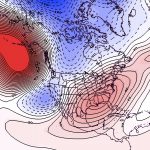
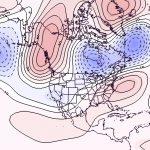
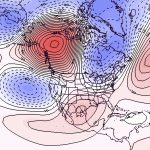
March 2026 tied with March 2024 as the 2nd warmest March on record for the globe since 1850. Global temperatures were 2.36o F above the 1901-2000 mean. Of particular note this month were the very warm temperatures across the continental United States, and much below normal temperatures across northwest North America (Figure 8).
-
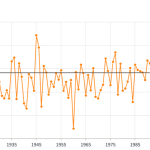
- Figure 1. Delaware statewide mean March temperature (degrees F) 1895-2026. The black line indicates the 1991-2020 average (NOAA, NCEI, Climate at a Glance: Statewide Time Series).
-
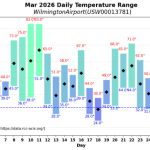
- Figure 2a. Daily average temperature, high temperature, and low temperature (degrees F) for Wilmington (top), and Georgetown (bottom) (RCC ACIS https://data.rcc-acis.org/).
-
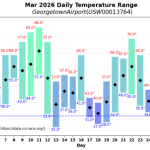
- Figure 2b. Daily average temperature, high temperature, and low temperature (degrees F) for Wilmington (top), and Georgetown (bottom) (RCC ACIS https://data.rcc-acis.org/).
-
- Figure 3. Delaware statewide March precipitation (inches) 1895-2026. The Black line indicates the 1991-2020 average (NOAA, NCEI, Climate at a Glance: Statewide Time Series).
-
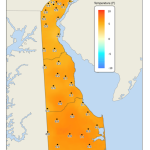
- Figure 4. March 2026 average temperature departures (degrees F) from the 1991-2020 mean based upon DEOS station data.
-
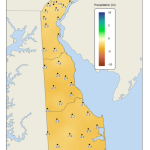
- Figure 5. March 2026 precipitation departures (inches) from the 1991-2020 mean based upon DEOS station data.
-
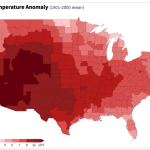
- Figure 6. United States climate division temperature anomalies (degrees F) for March 2026 (NOAA, NCEI, Climate at a Glance: Divisional Mapping).
-
- Figure 7. United States climate division precipitation anomalies (inches) for March 2026 (NOAA, NCEI, Climate at a Glance: Divisional Mapping).
-
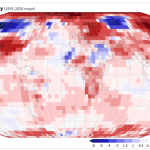
- Figure 8. Global temperature anomalies (degrees C) for March 2026 (NOAA, NCEI, Climate at a Glance: Global Mapping).