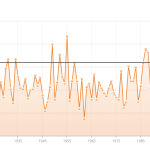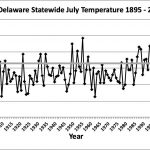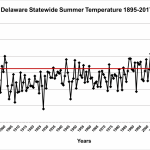
July Temperatures
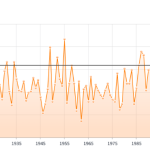
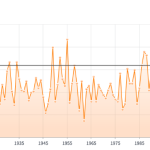
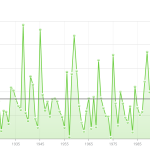
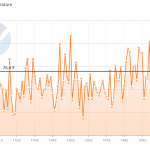
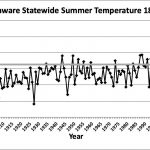
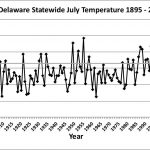
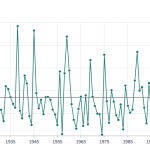
Preliminary data indicates that the statewide average temperature in July was 80.1°F, which is 2.7°F above the 1991-2020 mean value of 77.4°F (Figure 1). July 2025 was the 4th warmest July on record since 1895.
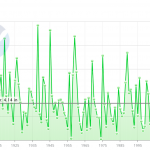
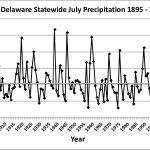
July Precipitation
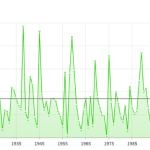
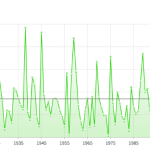
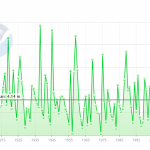
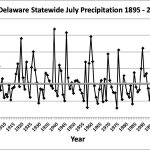
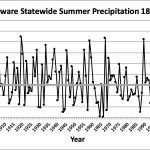
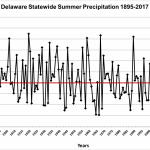
Delaware’s statewide precipitation for July 2025 averaged 7.75 inches, 3.33 inches above the 1991-2020 mean of 4.42 inches (Figure 2). July 2025 was the 10th wettest July since records began in 1895.
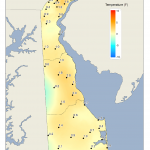
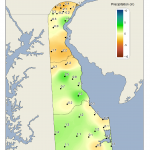
Statewide Spatial Anomalies
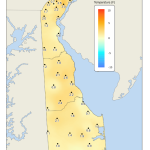
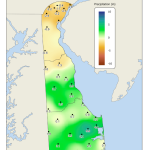
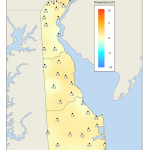
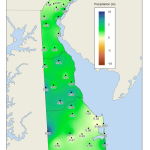
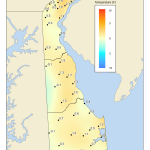
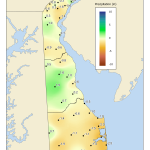
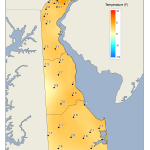
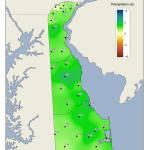
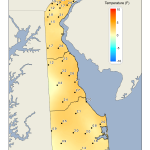
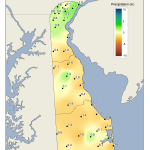
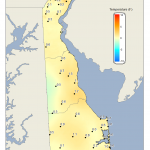
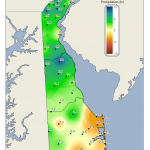
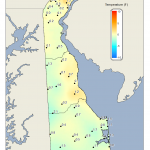
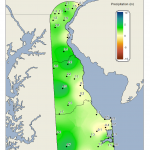
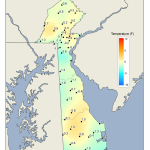
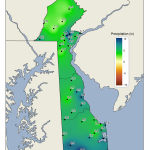
Data from the Delaware Environmental Observing System (DEOS) show that temperature departures were positive across the entire State (Figure 3), with most stations seeing positive anomalies of between 1° and 3°F. Precipitation varied greatly across the State due to the convective nature of rainfall associated with thunderstorms (Figure 4). Most stations saw above normal precipitation for the month, with some locations reaching positive departures of between 5 and 7 inches. In the extreme northeast portion of the State, more than 11 inches of rain fell during the month.
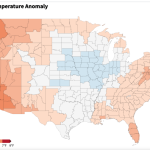
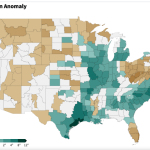
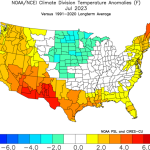
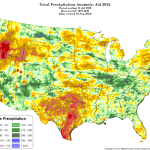
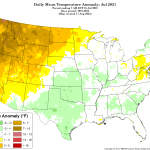
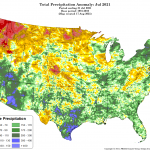
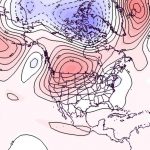
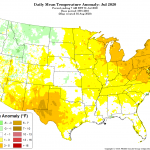
National Anomalies
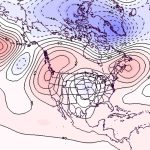
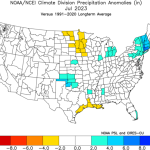
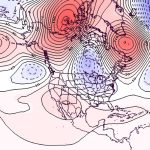
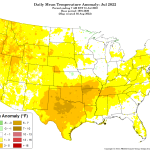
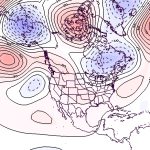
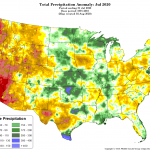
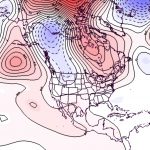
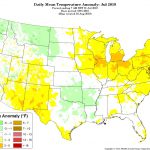
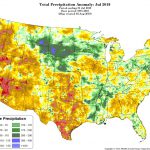
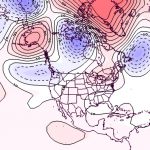
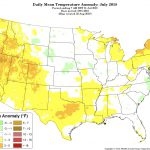
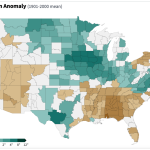
Temperatures were above normal across the entire United States except for some near normal values spread across the central portion of the country, and parts of California and Nevada (Figure 5). Precipitation varied across the country (Figure 6) with much of the eastern portions of the United States seeing negative precipitation anomalies, especially the Gulf Coast, while the upper Midwest and Plains, parts of Texas, and the Mid-Atlantic saw above normal precipitation during the month. The 500 hPa height pattern for July showed a weak jet stream ridge across the eastern one-half of the country, contributing to the generally positive temperature anomalies across that region (Figure 7).
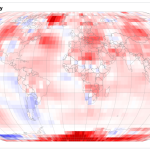
Global Anomalies
July 2025 ranked as the third warmest July on record for the globe since 1850. Global temperatures were 1.80°F (1.00°C) above the 1901-2000 mean. Particular warmth was found across eastern Asia and parts of Europe, while cooler than normal conditions were scattered across much of Antarctica (Figure 8).
-
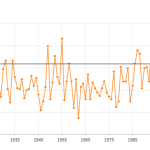
- Figure 1. Delaware statewide mean July temperature (degrees F) 1895-2025. The black line indicates the 1991-2020 normal (NOAA, NCEI, Climate at a Glance: Statewide Time Series).
-
- Figure 2. Delaware statewide July precipitation (inches) 1895-2025. The Black line indicates the 1991-2020 normal (NOAA, NCEI, Climate at a Glance: Statewide Time Series).
-
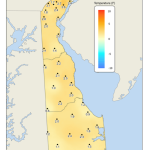
- Figure 3. July 2025 average temperature departures (degrees F) from the 1991-2020 mean based upon DEOS station data.
-
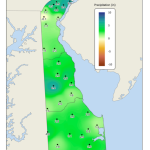
- Figure 4. July 2025 precipitation departures (inches) from the 1991-2020 mean based upon DEOS station data.
-
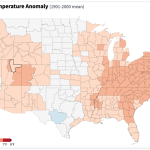
- Figure 5. United States climate division temperature anomalies (degrees F) for July 2025 (NOAA, NCEI, Climate at a Glance: Divisional Mapping).
-
- Figure 6. United States climate division precipitation anomalies (inches) for July 2025 (NOAA, NCEI, Climate at a Glance: Divisional Mapping).
-
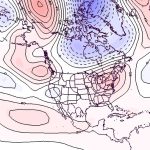
- Figure 7. 500 hPa geopotential height anomalies for July 2025. Negative (blue) anomalies indicate the presence of an anomalous jet stream trough while positive (red) height anomalies indicate the presence of an anomalous jet stream ridge.
-
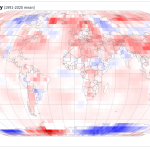
- Figure 8. Global temperature anomalies (degrees C) for July 2025 (NOAA, NCEI, Climate at a Glance: Global Mapping).