February Temperatures
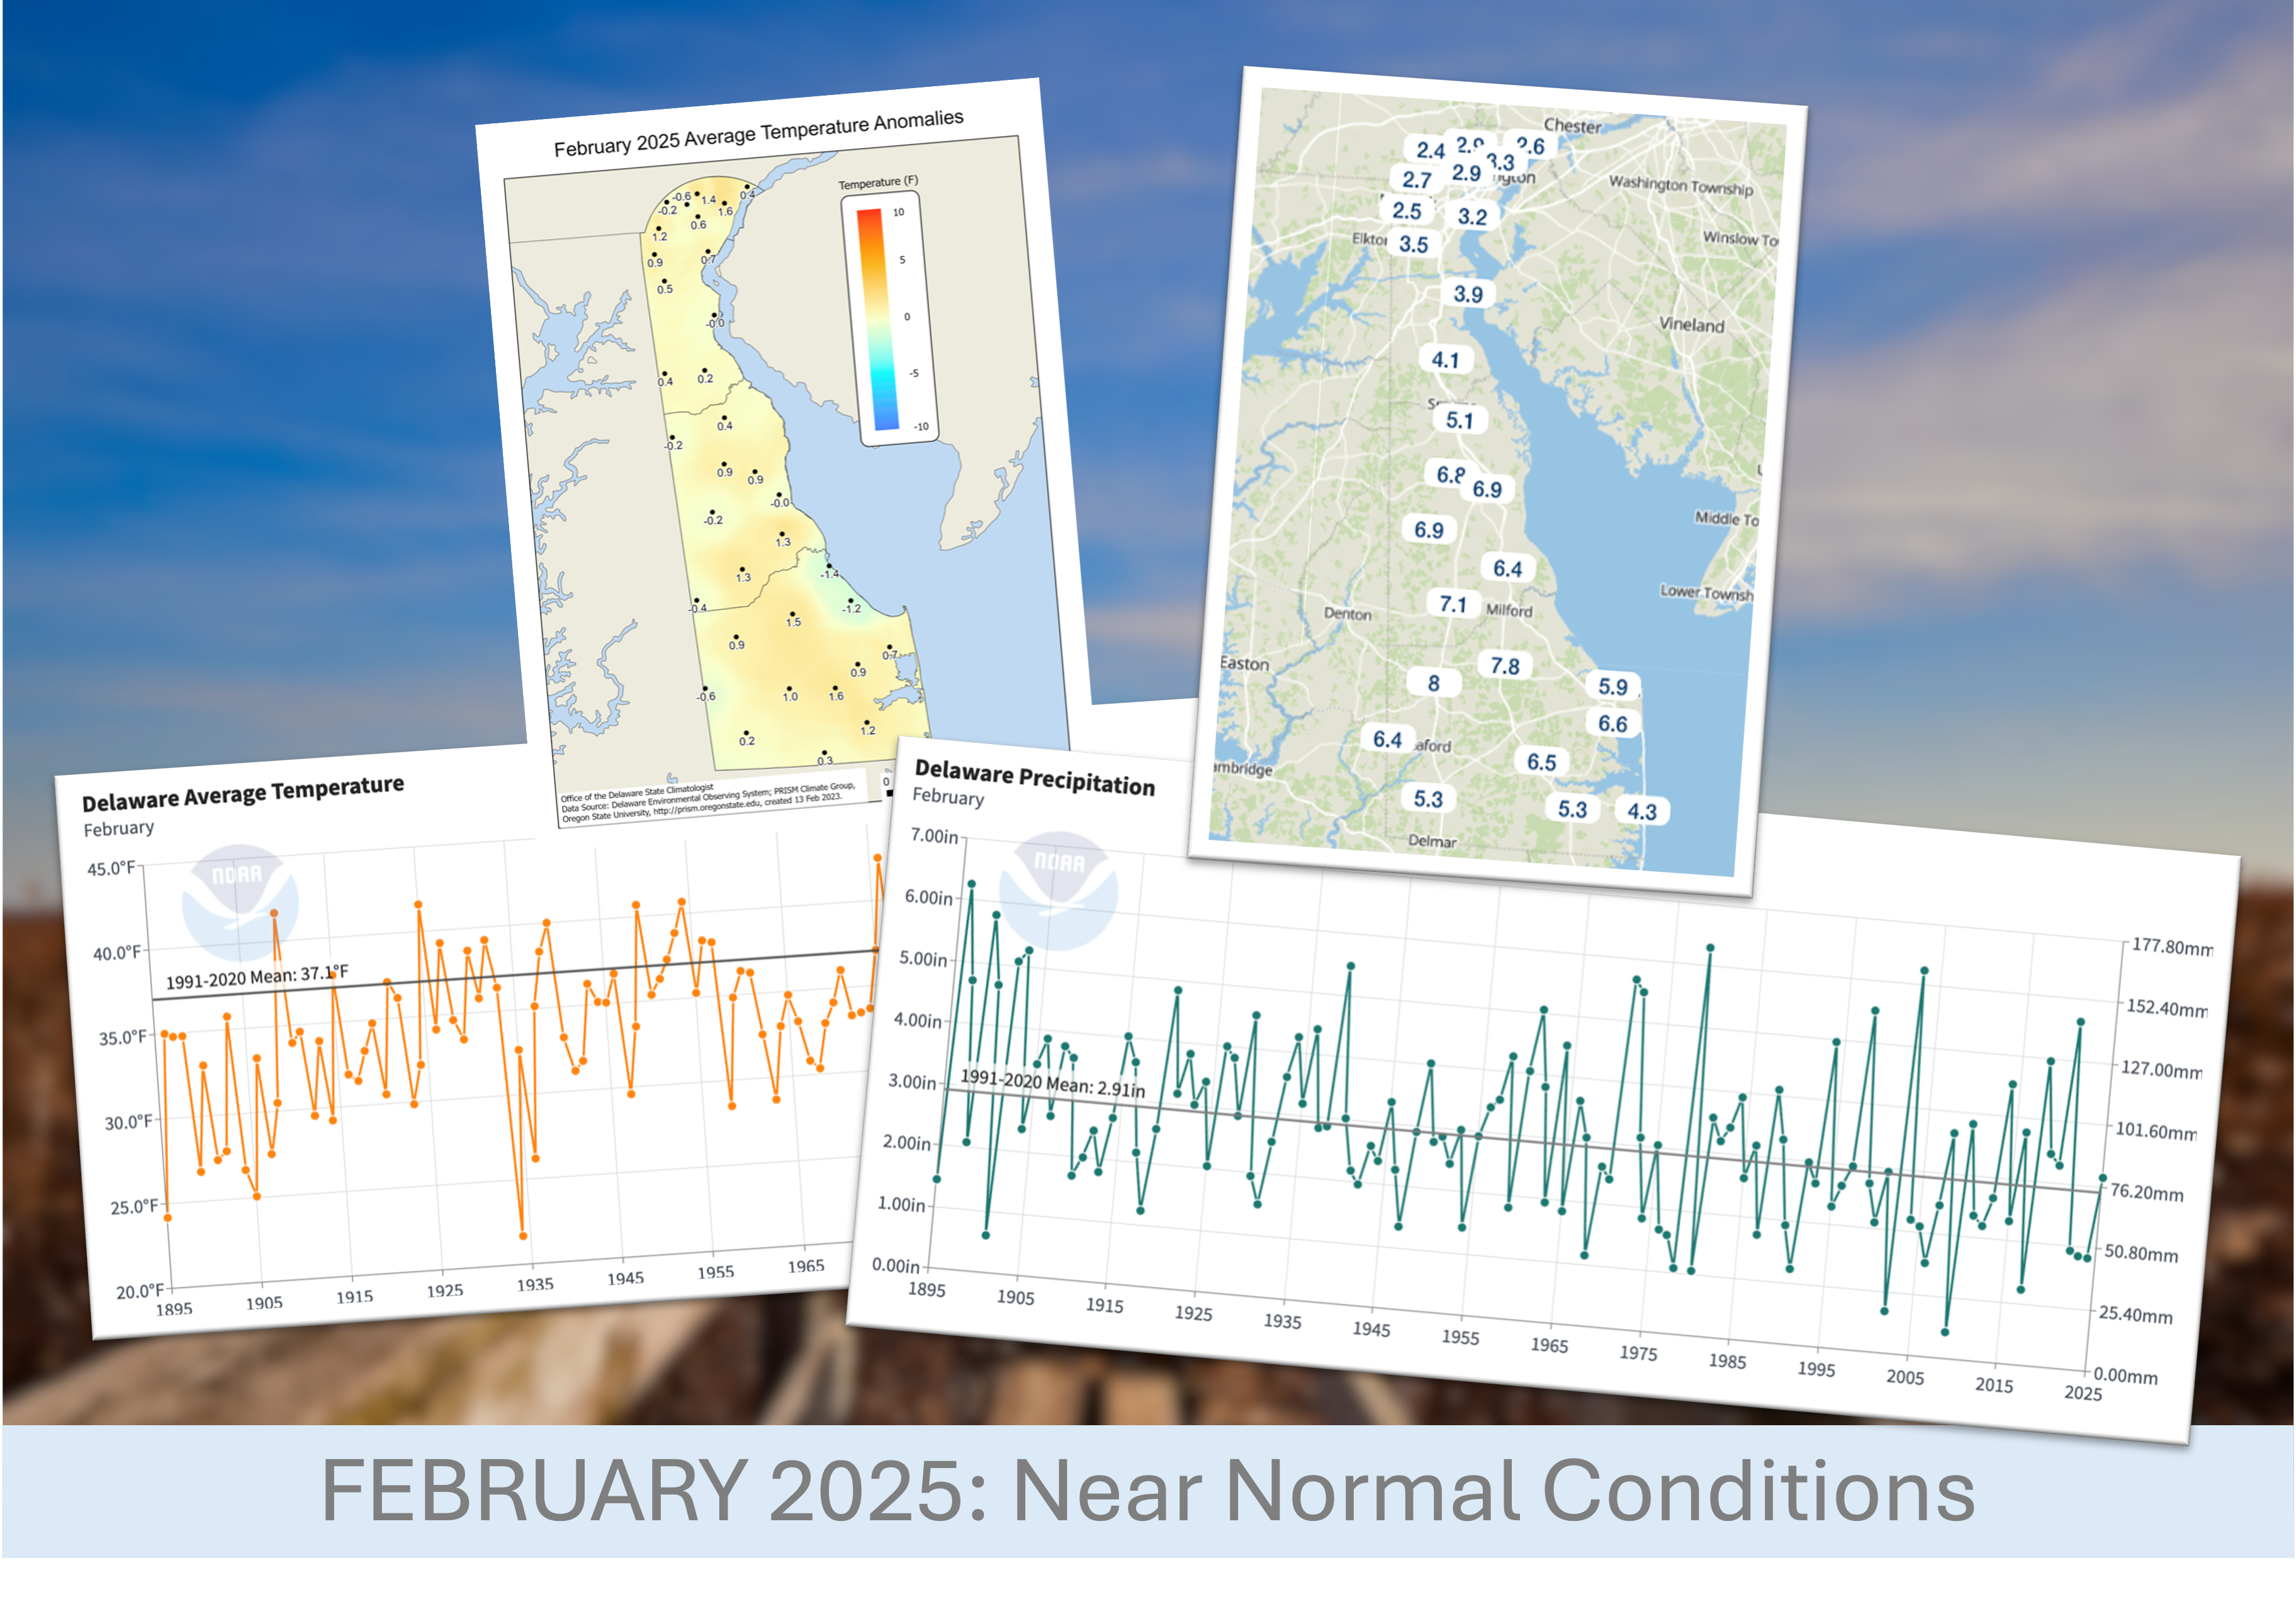
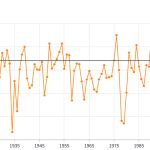
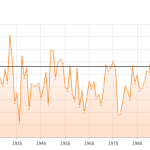
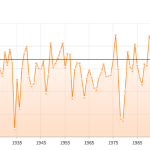
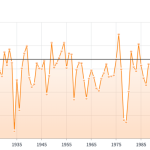
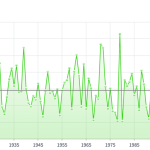
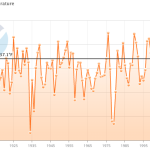
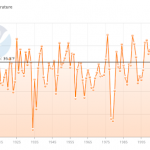
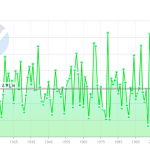
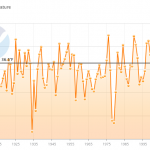
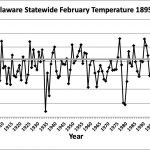
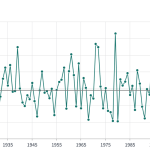
Preliminary data indicates that the statewide average temperature in February was 32.3o F, which is 4.8o F below the 1991-2020 average value of 37.1o F (Figure 1). February 2026 was the 34th coldest February since observations began in 1895. Daily temperatures in February began with a cold spell that lasted from the 1st through the 9th, with temperatures bottoming out on the 8th and 9th across the State (Figures 2a, 2b, 2c). The latter two-thirds of the month saw warmer temperatures, but not enough to bring the monthly average temperature back to normal.
February Precipitation
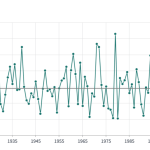
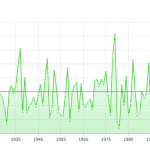
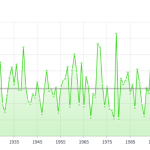
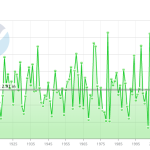
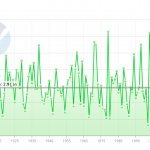
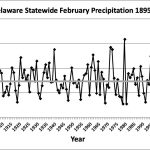
Delaware’s statewide precipitation for February 2026 averaged 2.84 inches, 0.07 inches below the 1991-2020 average of 2.91 inches (Figure 3). Precipitation in February 2026 was near the average of all 132 February precipitation observations since 1895.
Statewide Spatial Anomalies
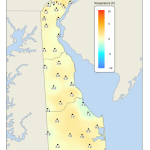
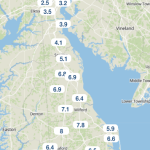
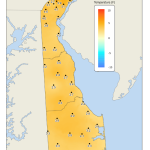
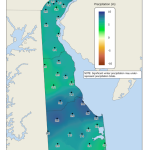
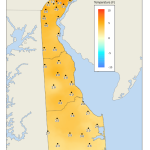
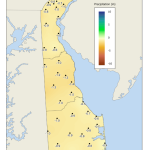
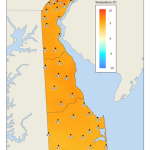
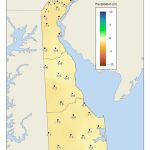
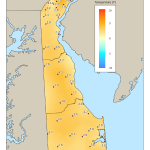
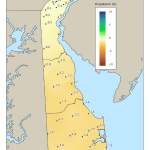
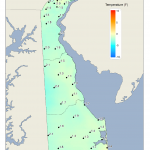
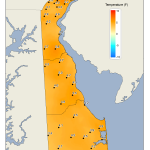
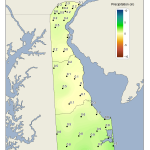
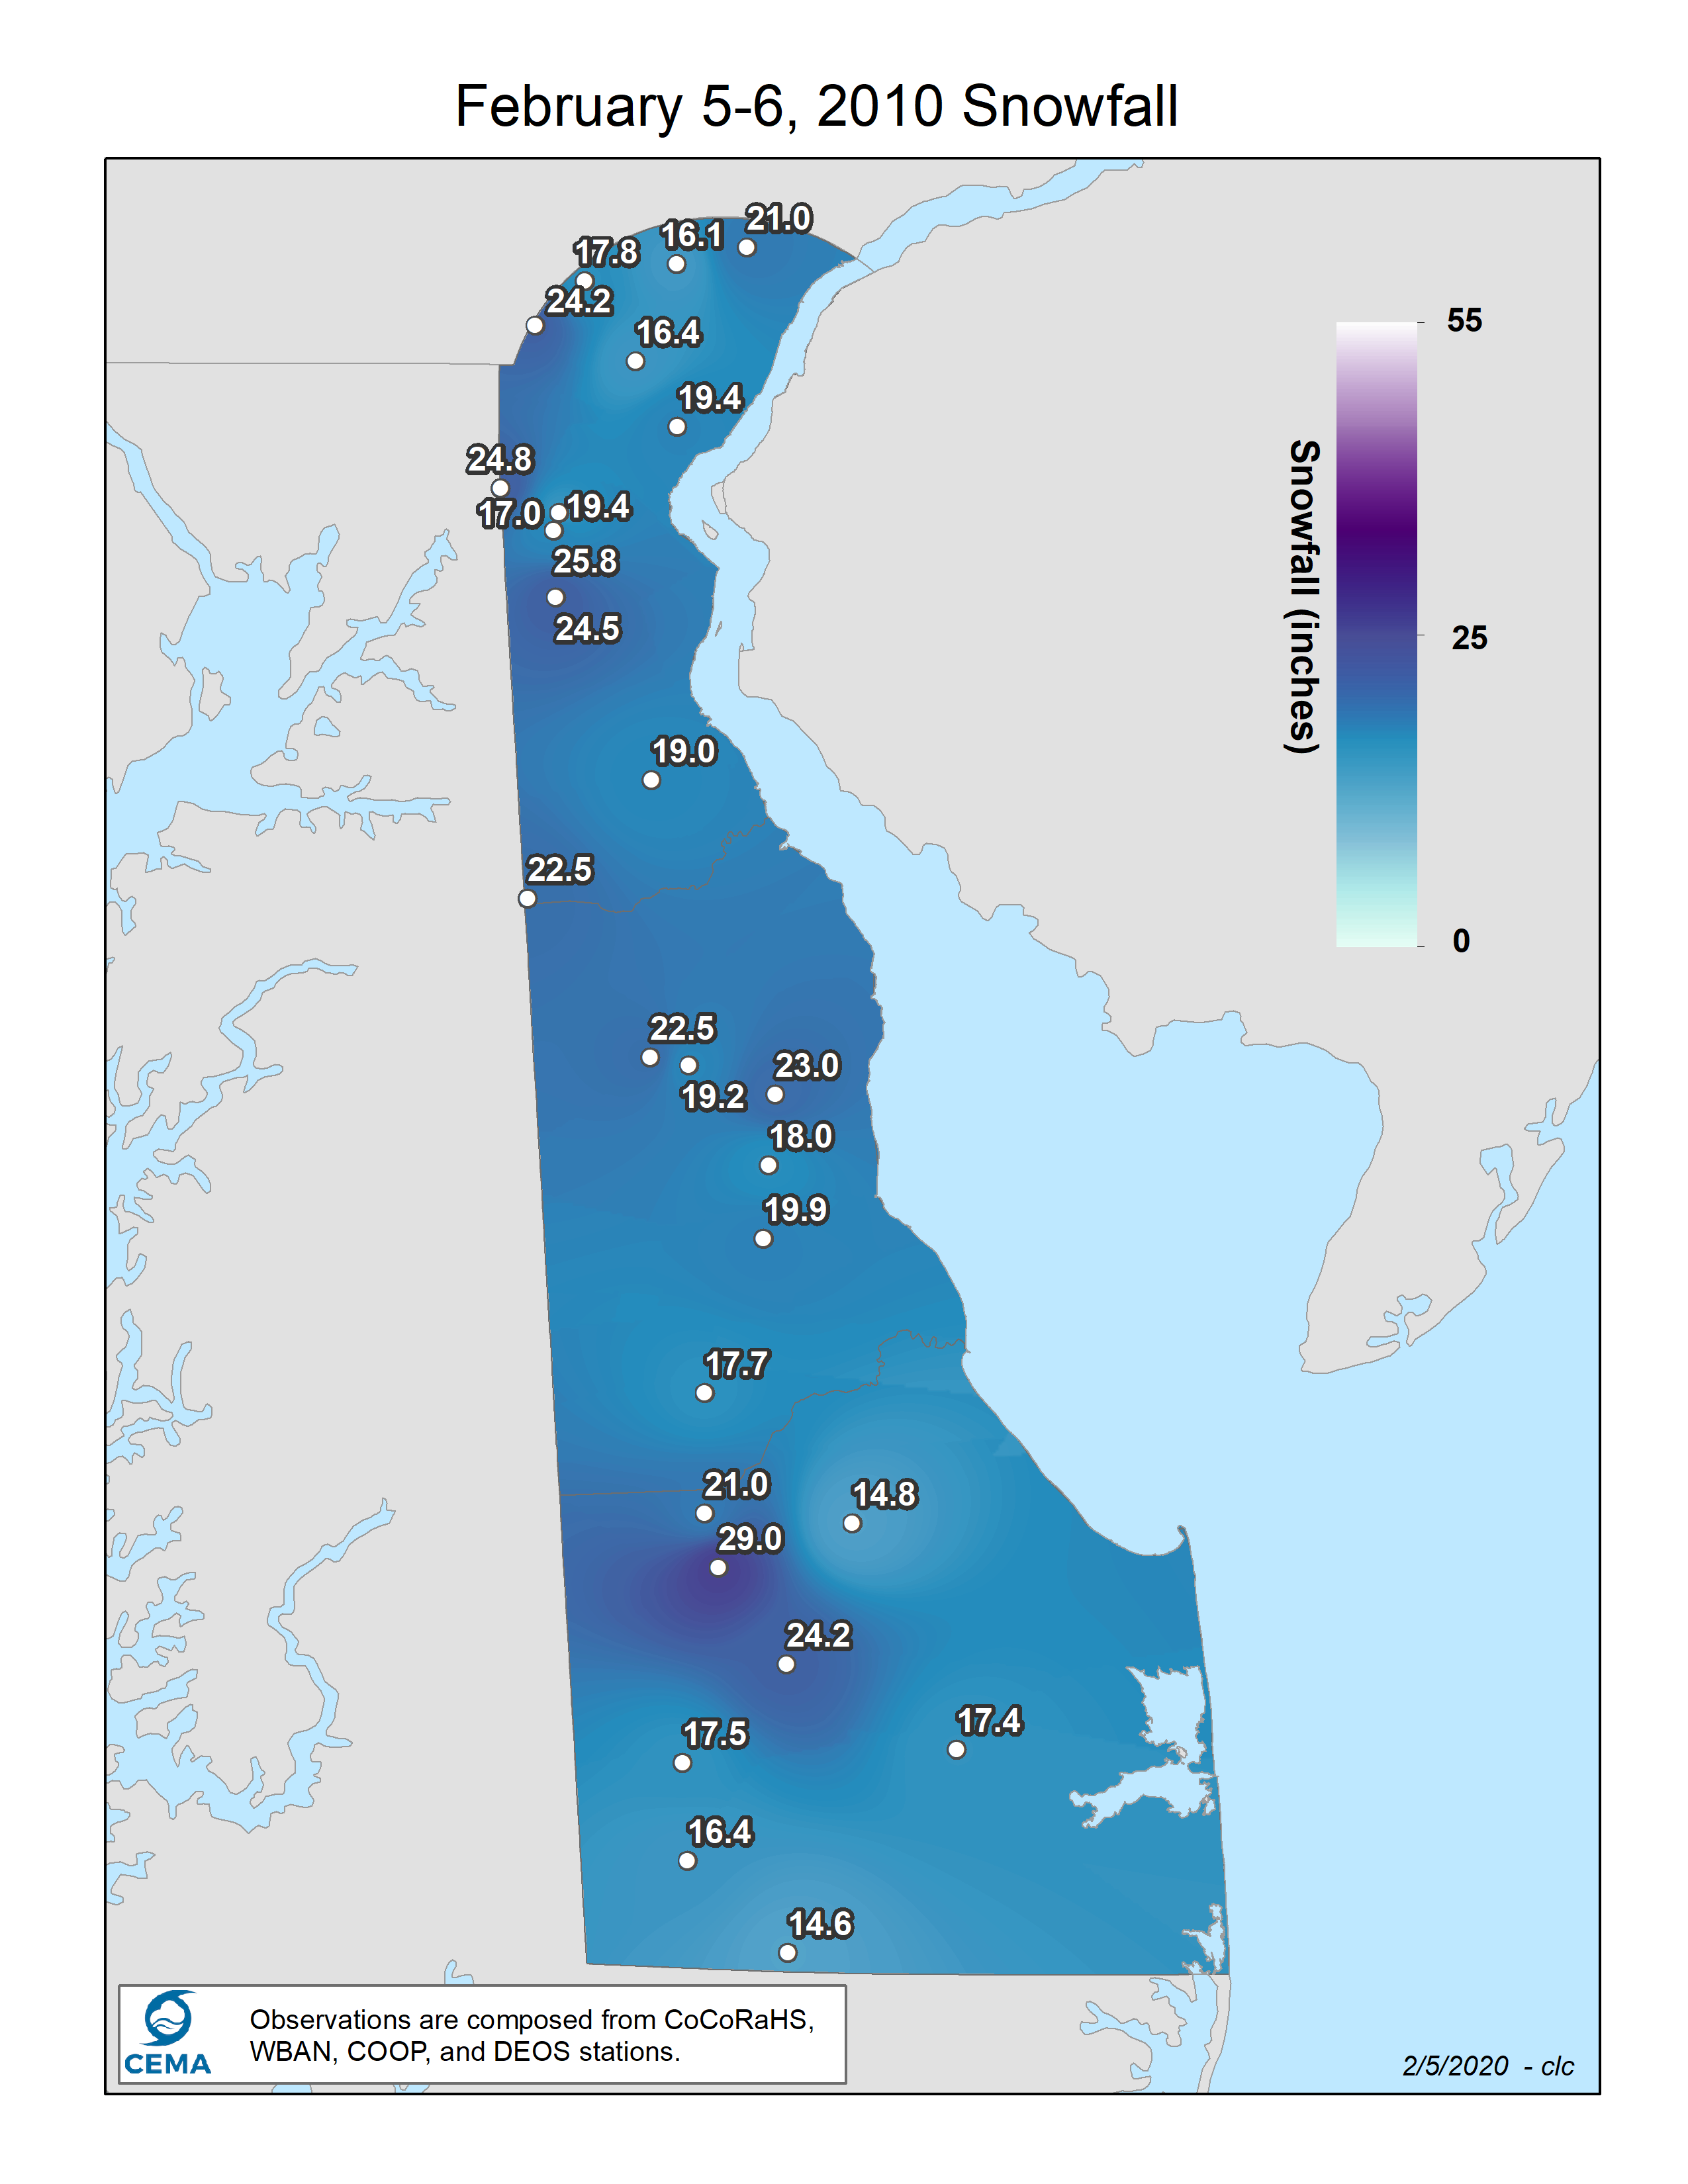
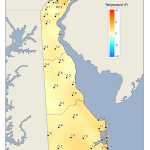
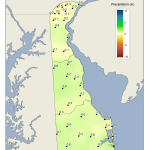
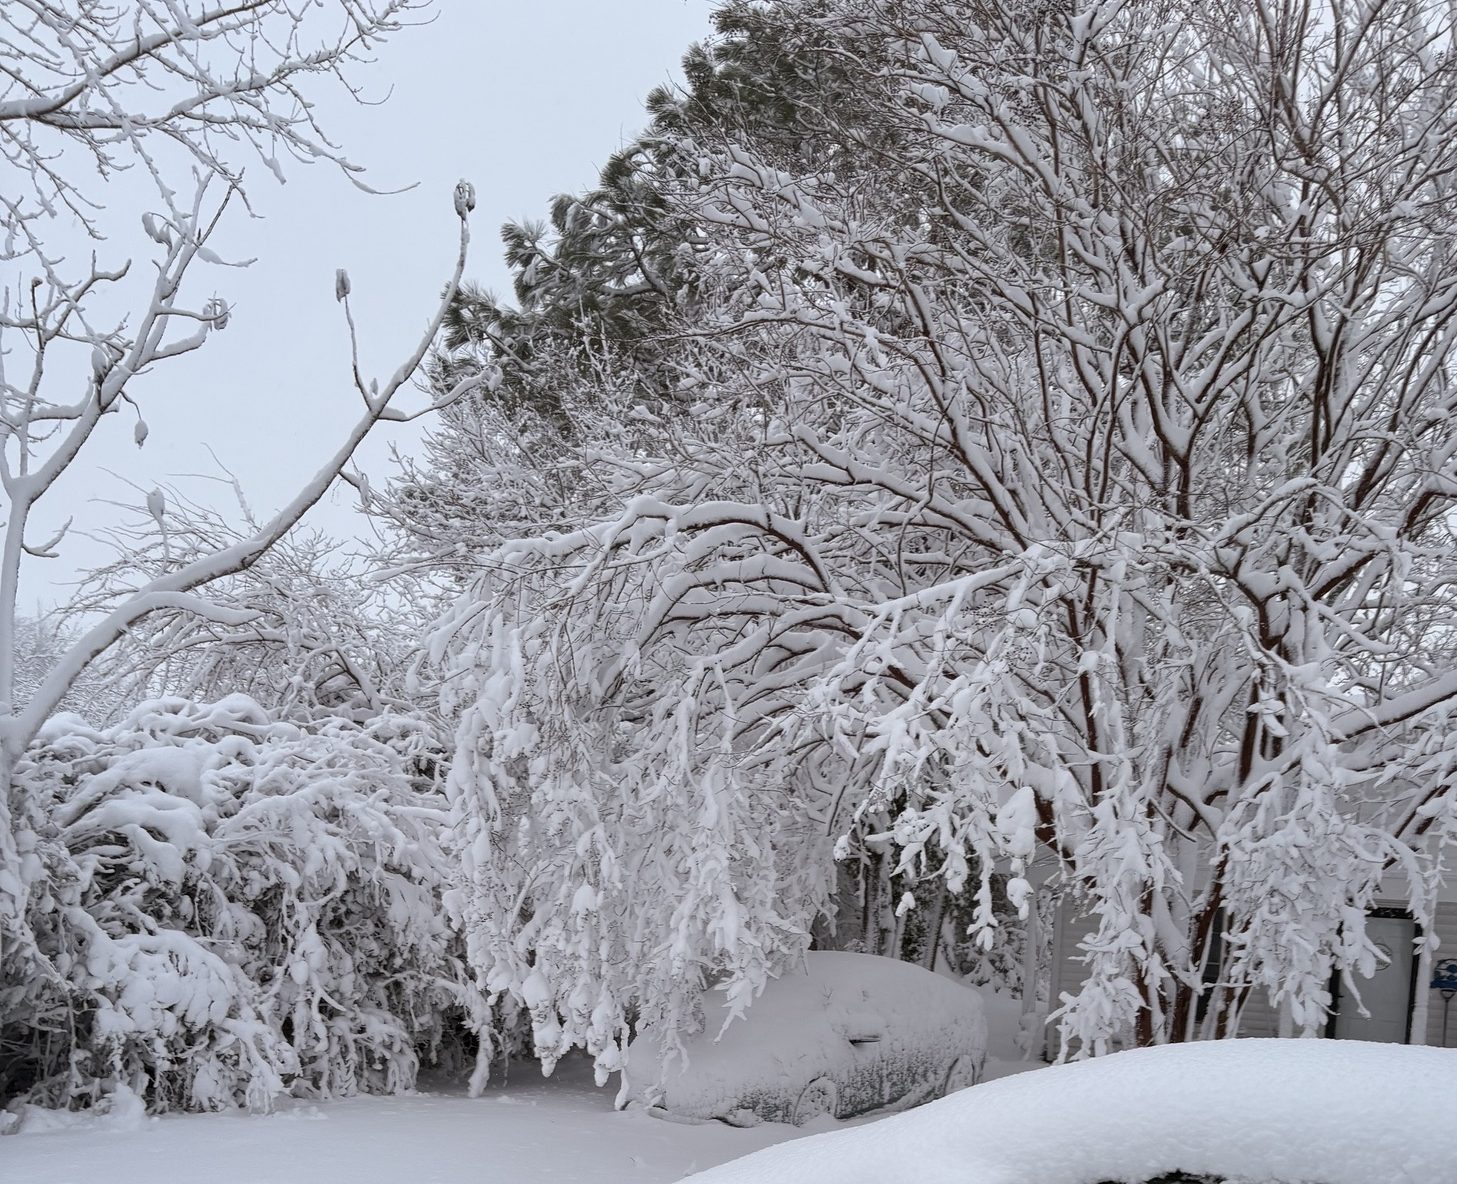
Data from the Delaware Environmental Observing System (DEOS) show that temperatures were uniformly cold across the State, with many locations seeing negative departures of between 3o F and 4o F (Figure 4). A significant snowfall event took place across Delaware on February 22nd, dropping over 10 inches of snow across much of the southern one-half of the State, with a maximum of 15.5” recorded in Dagsboro, DE (Figure 5).
National Anomalies
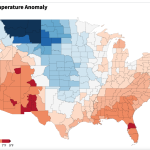
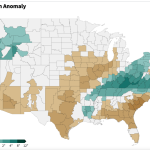
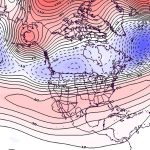
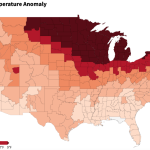
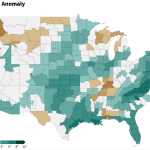
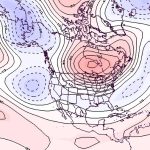
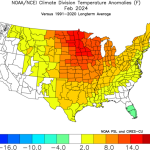
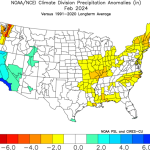
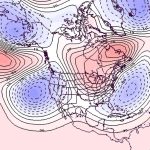
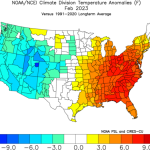
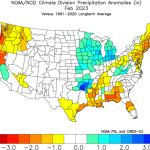
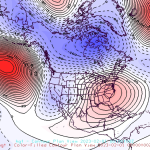
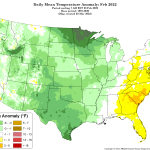
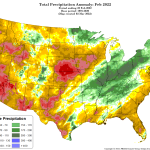
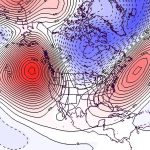
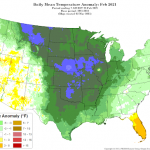
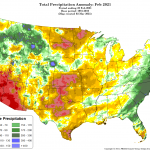
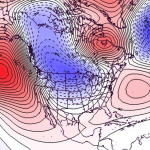
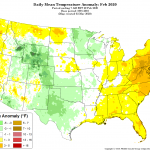
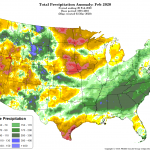
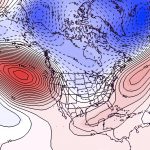
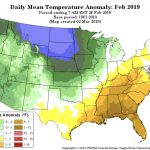
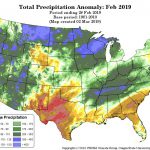
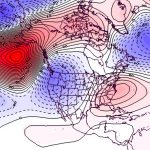
Temperatures were below normal across much of the Atlantic Coast (Figure 6), while the western three-quarters of the United States saw much above normal temperatures, with portions of the northern Great Plains seeing positive temperature departures of more than 9o F. Precipitation was generally below normal in the eastern one-half of the country, especially in the lower Mississippi Valley, while portions of California and the northern Great Lakes saw above average amounts (Figure 7). The 500 hPa height pattern for February showed an anomalous jet stream ridge covering the western two-thirds of the United States (Figure 8), and a jet stream trough along the Atlantic Coast contributing to the temperature anomalies across those regions.
Global Anomalies
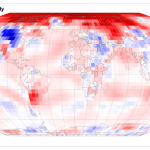
February 2026 ranked as the 5th warmest February on record for the globe since 1850. Global temperatures were 2.12o F above the 1901-2000 mean. Of particular note this month was a zone of colder than normal temperatures across much of the high latitudes of the Northern Hemisphere (Figure 9).
-
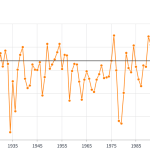
- Figure 1. Delaware statewide mean February temperature (degrees F) 1895-2026. The black line indicates the 1991-2020 average (NOAA, NCEI, Climate at a Glance: Statewide Time Series).
-
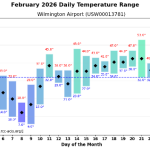
- Figure 2a. Daily average temperature (black dot), high temperature (red text), and low temperature (blue text) for Wilmington. Units: degrees Fahrenheit; Source: RCC ACIS https://data.rcc-acis.org/.
-
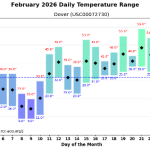
- Figure 2b. Daily average temperature (black dot), high temperature (red text), and low temperature (blue text) for Dover. Units: degrees Fahrenheit; Source: RCC ACIS https://data.rcc-acis.org/.
-
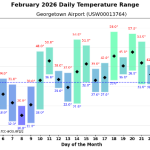
- Figure 2c. Daily average temperature (black dot), high temperature (red text), and low temperature (blue text) for Georgetown. Units: degrees Fahrenheit; Source: RCC ACIS https://data.rcc-acis.org/.
-
- Figure 3. Delaware statewide February precipitation (inches) 1895-2026. The Black line indicates the 1991-2020 average (NOAA, NCEI, Climate at a Glance: Statewide Time Series).
-
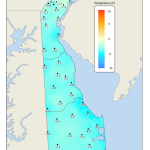
- Figure 4. February 2026 average temperature departures (degrees F) from the 1991-2020 mean based upon DEOS station data.
-
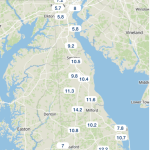
- Figure 5. February 22nd, 2026 snowfall totals (inches) based upon DEOS station data.
-
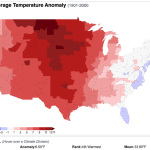
- Figure 6. United States climate division temperature anomalies (degrees F) for February 2026 (NOAA, NCEI, Climate at a Glance: Divisional Mapping).
-
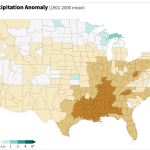
- Figure 7. United States climate division precipitation anomalies (inches) for February 2026 (NOAA, NCEI, Climate at a Glance: Divisional Mapping).
-
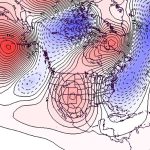
- Figure 8. 500 hPa geopotential height anomalies for February 2026. Negative (blue) anomalies indicate the presence of an anomalous jet stream trough while positive (red) height anomalies indicate the presence of an anomalous jet stream ridge.
-
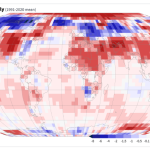
- Figure 9. Global temperature anomalies (oC) for February 2026 (NOAA, NCEI, Climate at a Glance: Global Mapping).