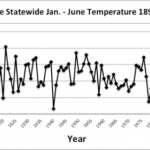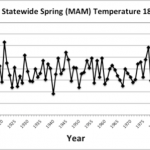
Spring Temperatures

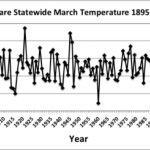
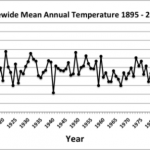
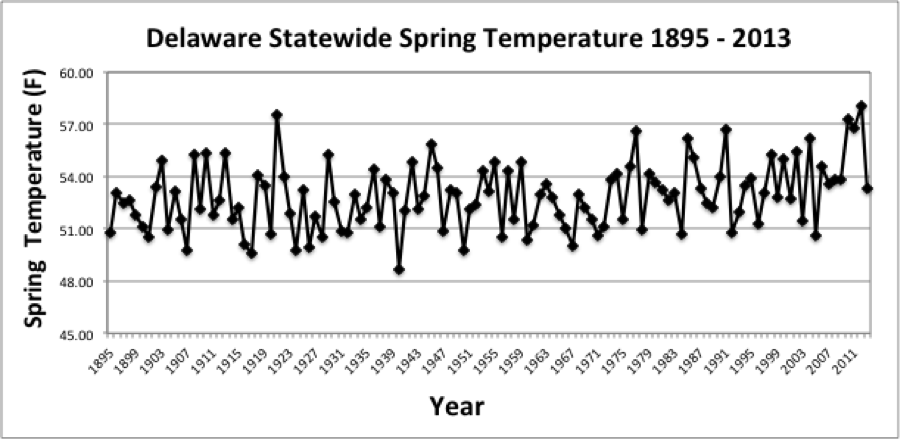
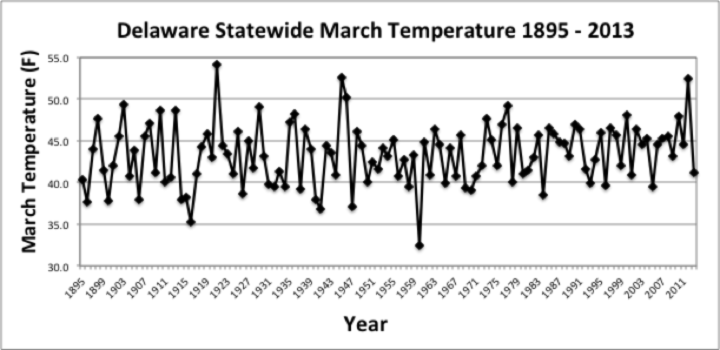
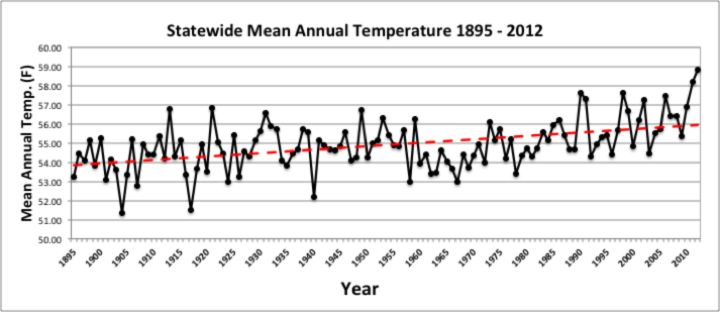
Preliminary data indicates that Delaware experienced its second cooler than normal spring in a row in 2014. The Statewide mean spring temperature of 52.6°F was 0.8°F below the 1981-2010 normal of 53.4°F (Figure 1). Spring 2014 was the coolest spring in the last nine years (since 2005).
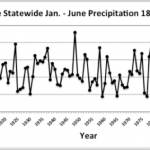
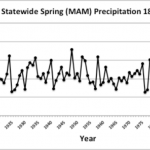
Spring Precipitation
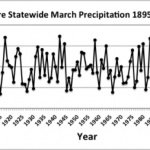
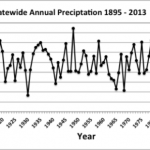
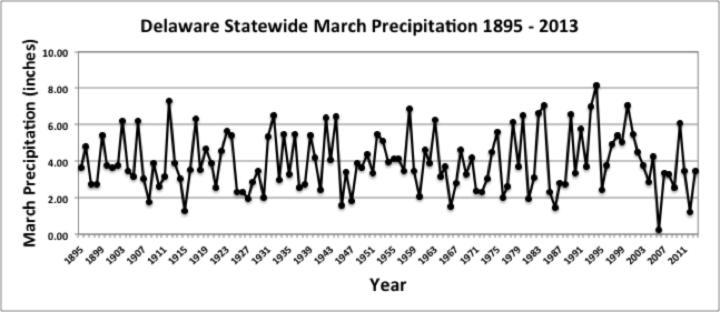
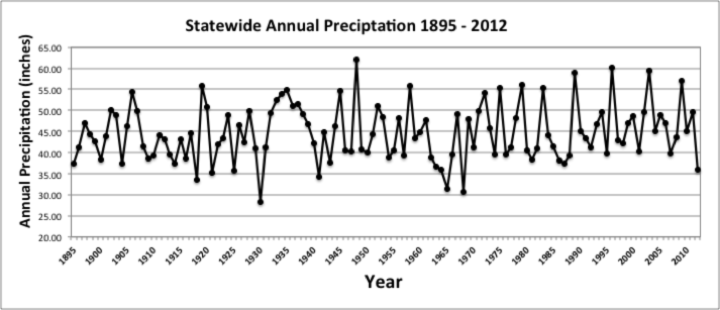
Cool temperatures were accompanied by near normal
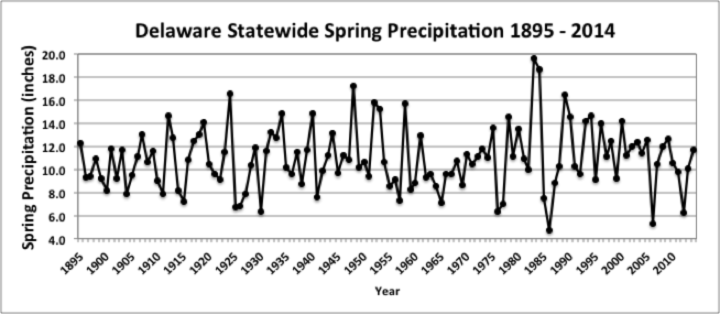
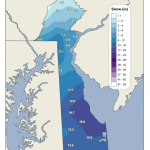
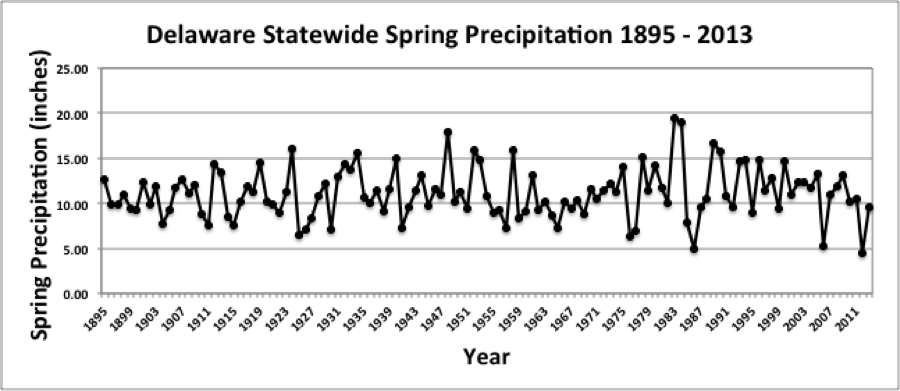
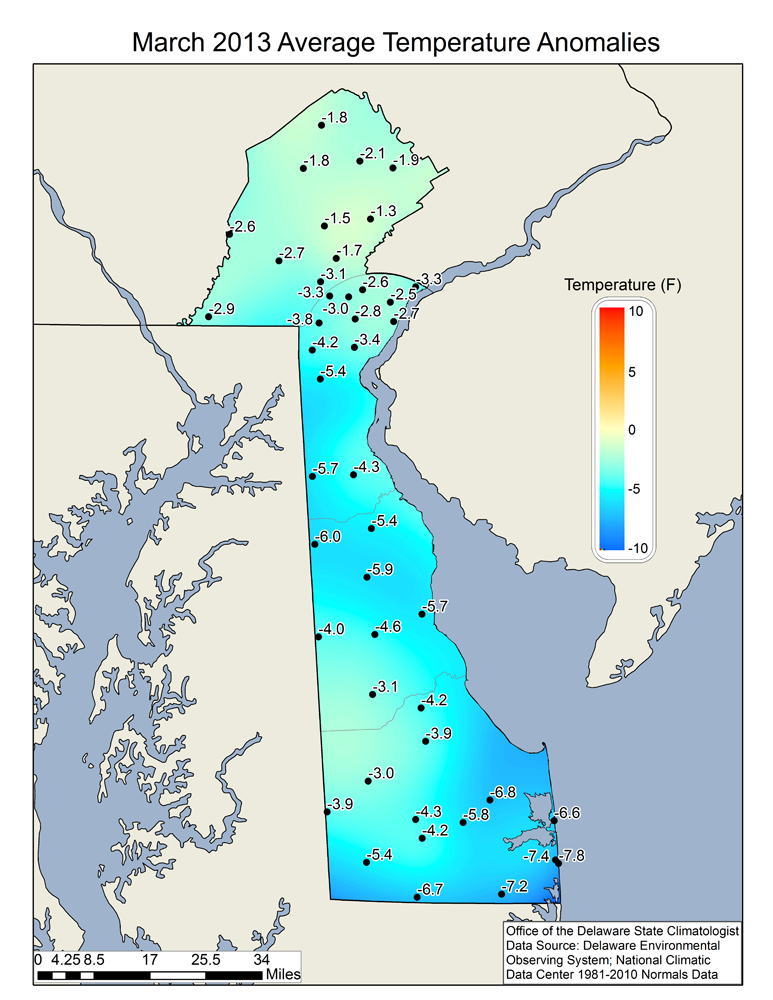
precipitation across the state during the spring season. The statewide mean precipitation of 11.53” was 0.17” below the 1981-2010 normal of 11.70”, and was the 5th year in a row with below normal spring precipitation (Figure 2). Although spring precipitation was near normal, spring snowfall (March) was much above normal especially in southern sections of Delaware (Figure 3).
Statewide Spatial Averages
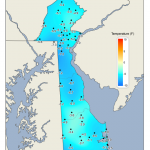
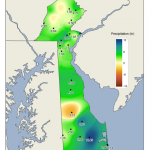
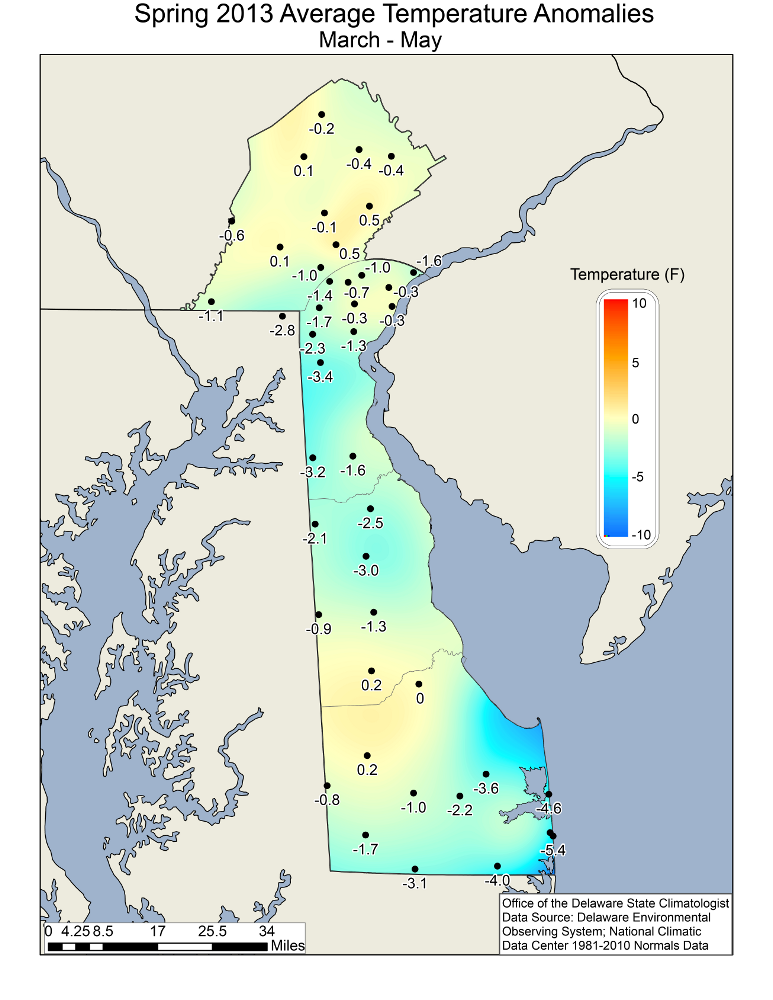
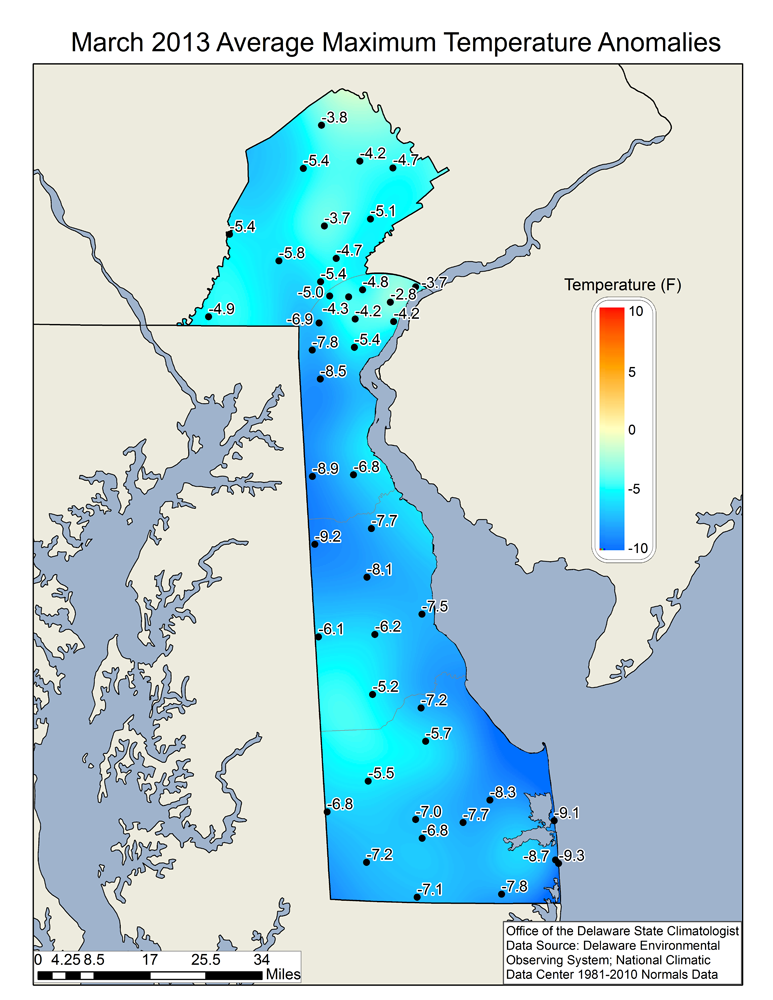
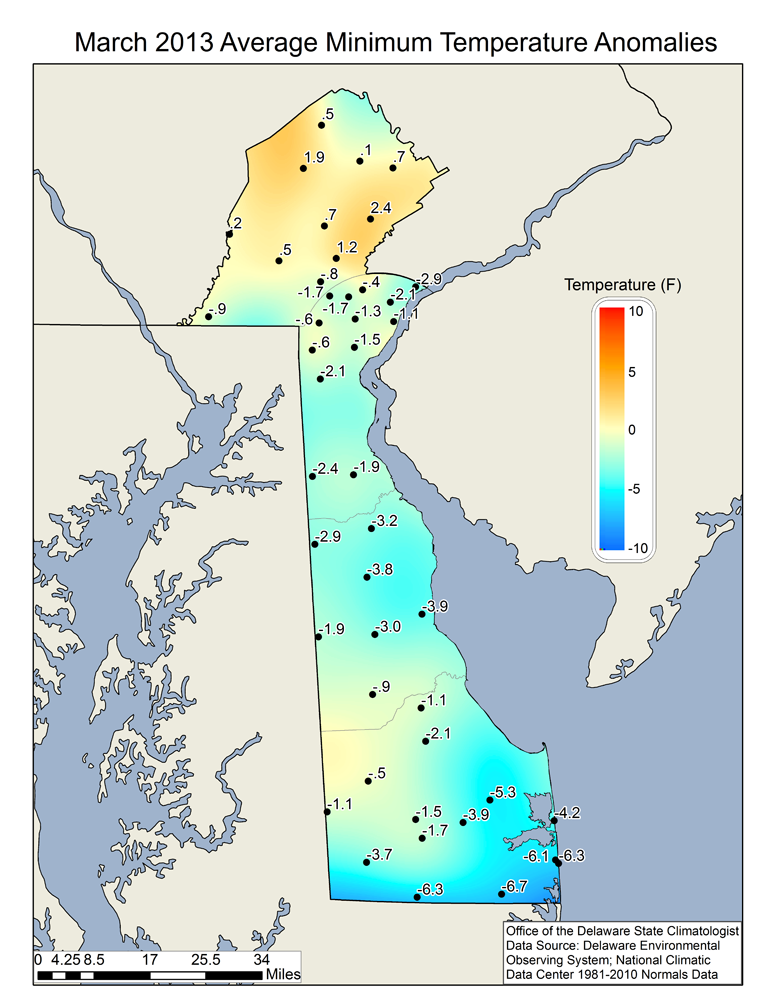
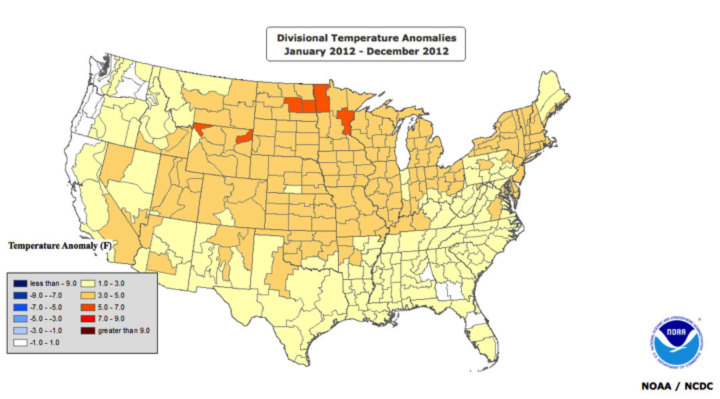
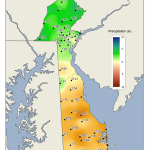
Data from the Delaware Environmental Observing System (DEOS) show that all stations across Delaware experienced below average temperatures during the spring season with the largest anomalies found along the Atlantic coast in Sussex County (up to 4°F below normal; Figure 4).
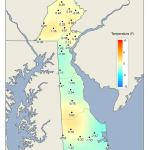
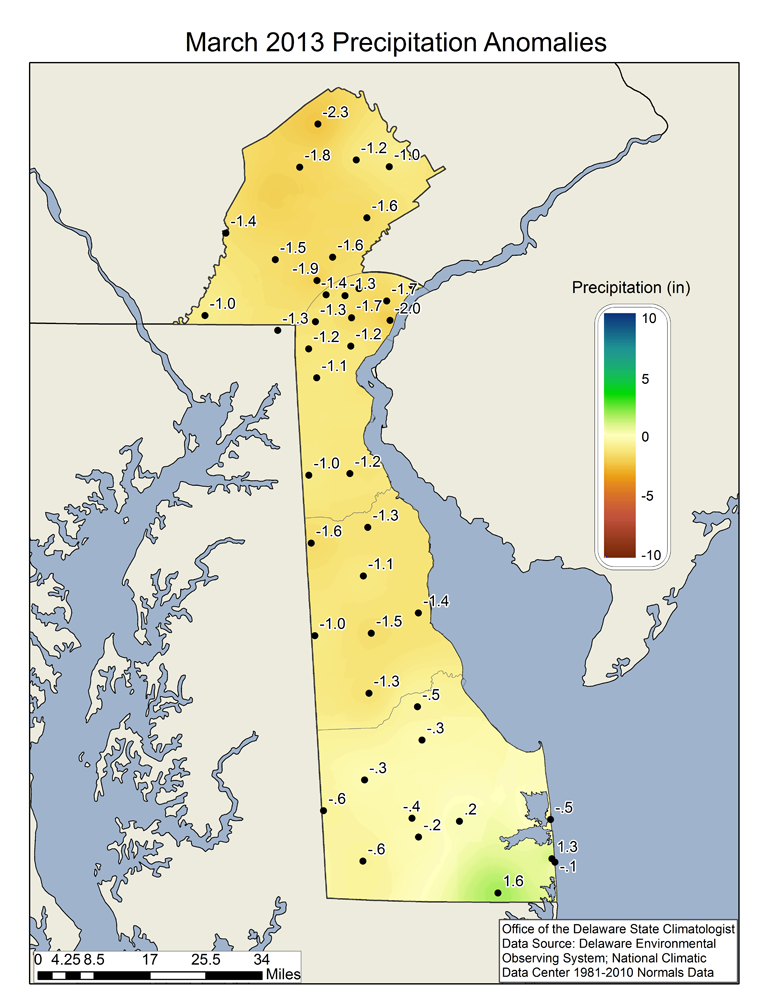
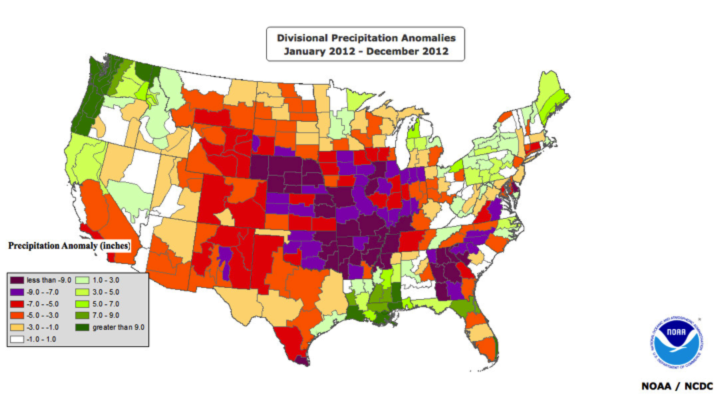
Nearly all stations in Kent and Sussex counties, recorded below normal precipitation for the spring season, with deficits of between 3 and 4 inches common across Sussex County. Across New Castle County, DE and Chester County, PA, precipitation was generally above normal, with positive anomalies of between 4 and 5 inches found at some stations in Chester County, PA (Figure 5).
-
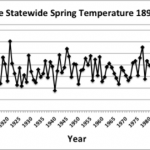
- Figure 1. Delaware statewide mean spring temperature (°F) 1895-2014.
-
- Figure 2. Delaware statewide spring precipitation (inches) 1895-2014.
-

- Figure 3. Spring (March) 2014 snowfall totals based upon DEOS station data.
-
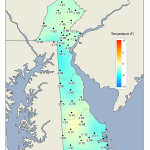
- Figure 4. Spring 2014 average temperature departures from the 1981-2010 mean based upon DEOS station data.
-
- Figure 5. Spring 2014 precipitation departures from the 1981-2010 mean based upon DEOS station data.