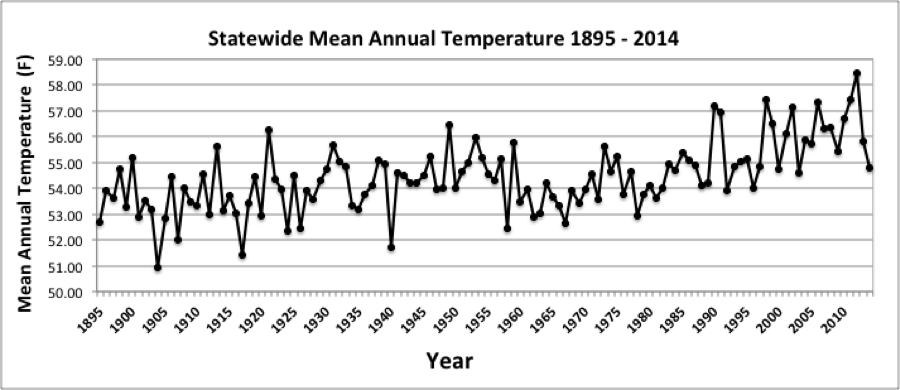
Spring Temperatures
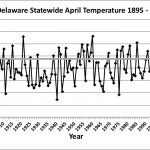
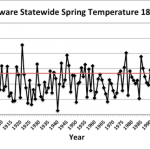
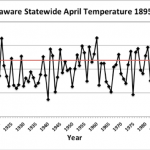
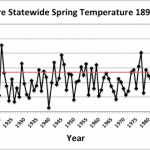
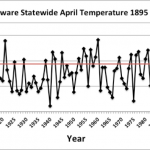
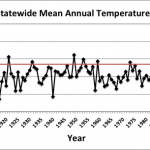
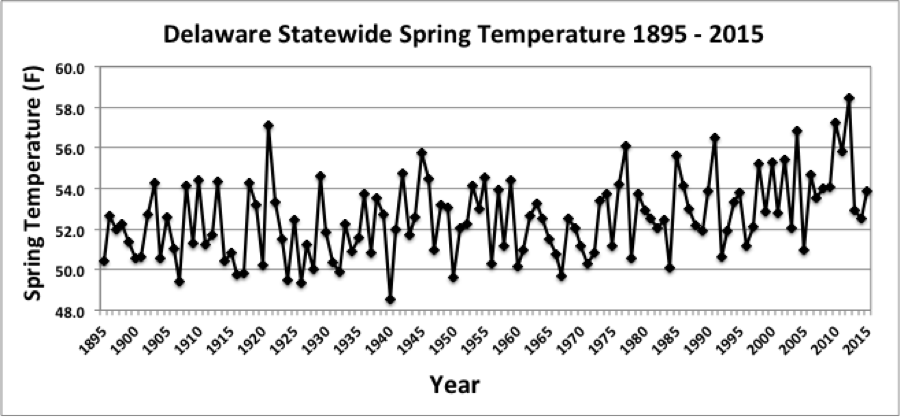
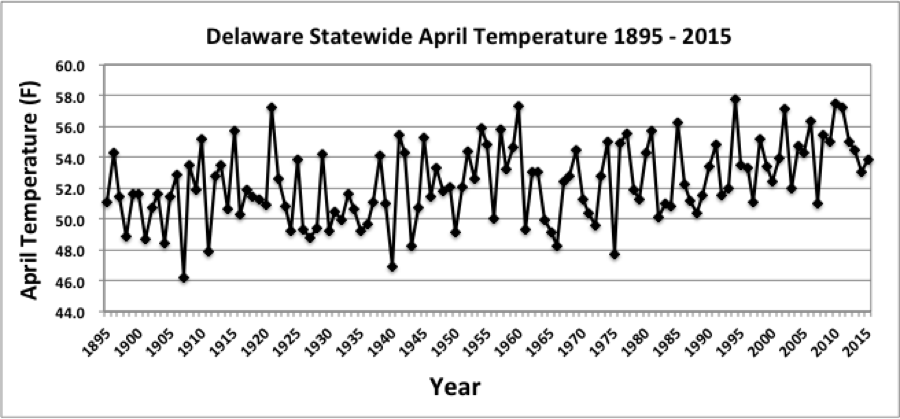
Preliminary data indicates that spring temperatures were exactly equal to the 30-year “normal” of 53.4°F (Figure 1). This was the fourth year in a row with spring temperatures at or above the 30-year mean.
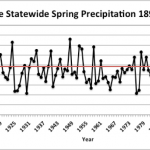
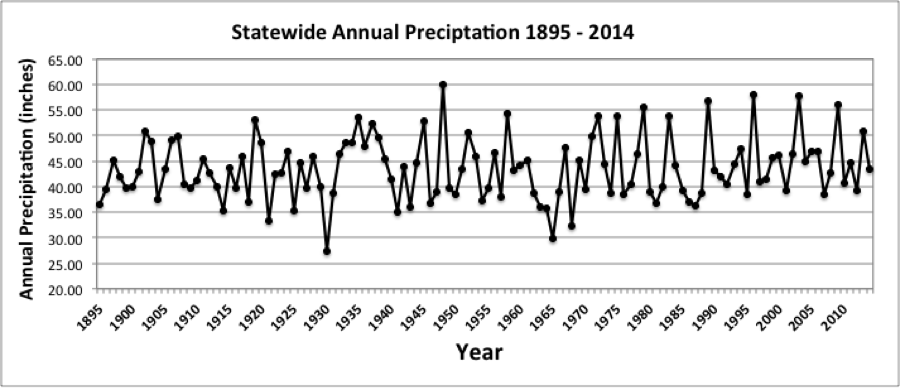
Spring Precipitation
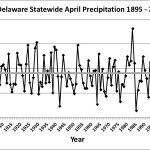
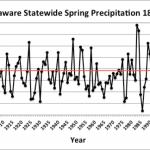
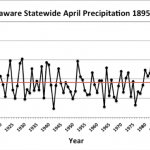
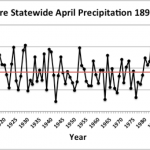
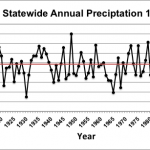
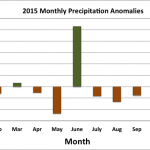
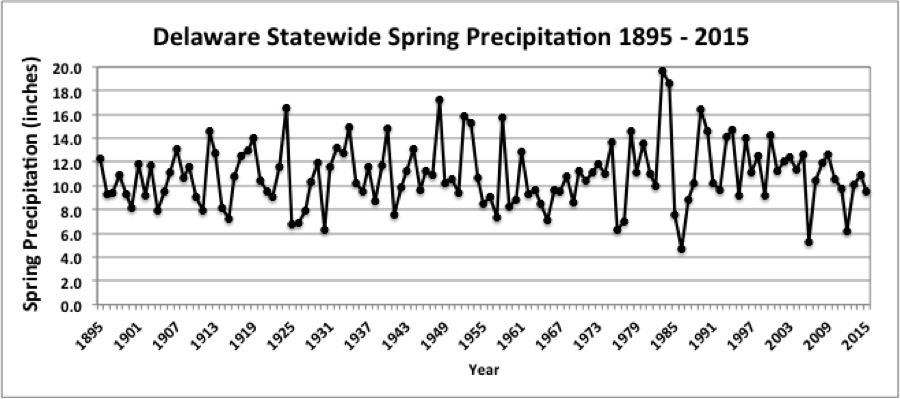
The statewide mean precipitation of 14.48 inches was 2.78 inches above the 1981-2010 normal of 11.70 inches, making it the 15th wettest since records began in 1895 (Figure 2).
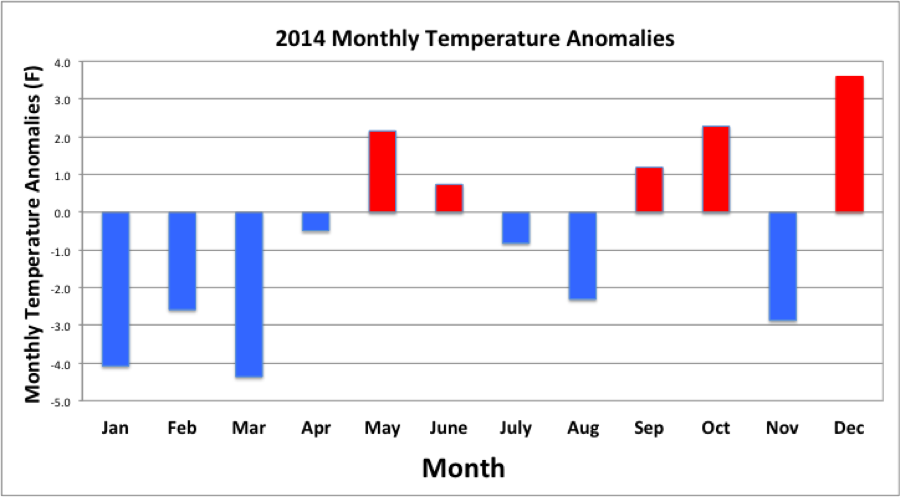
Statewide Spatial Averages
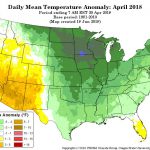
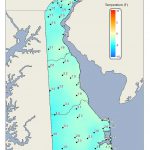
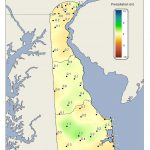
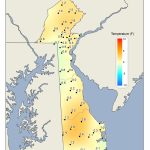
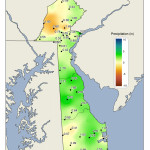
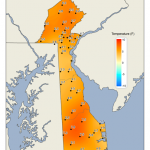
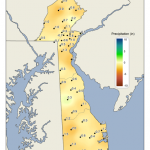
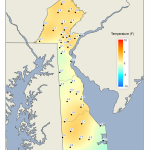
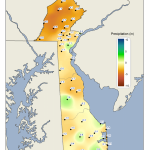
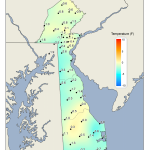
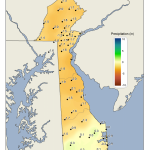
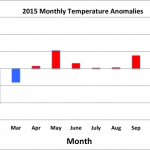
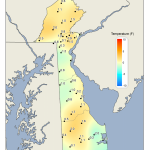
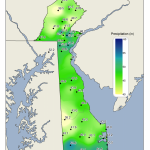
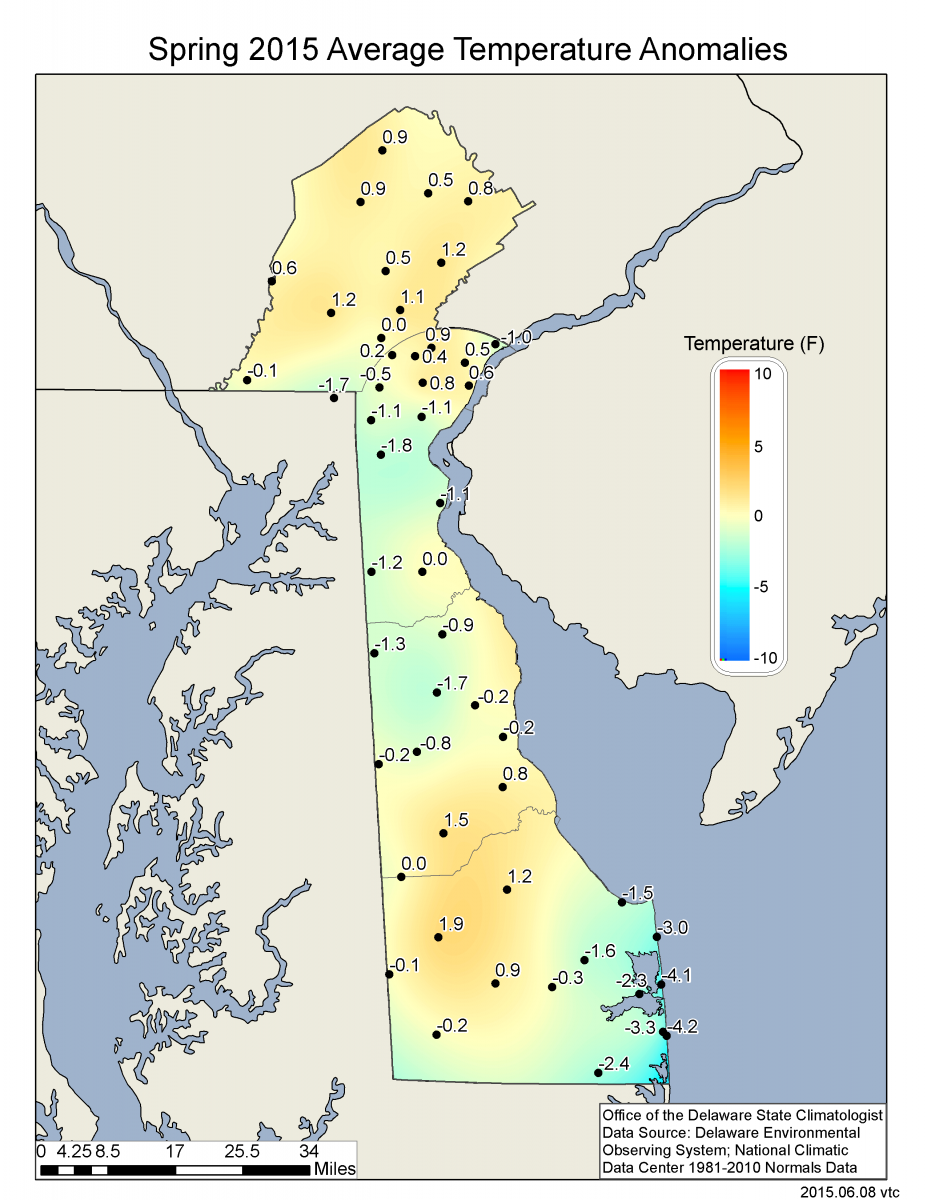
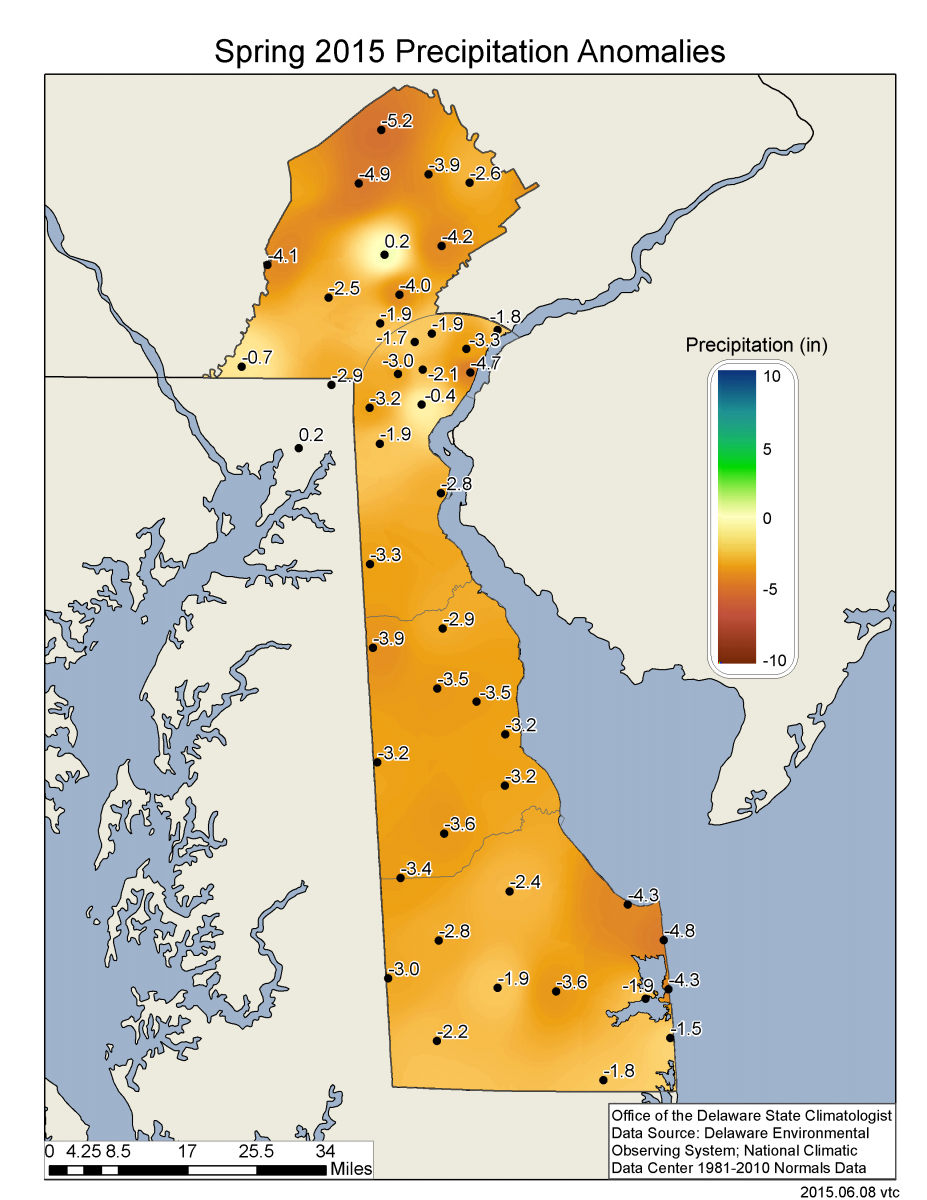
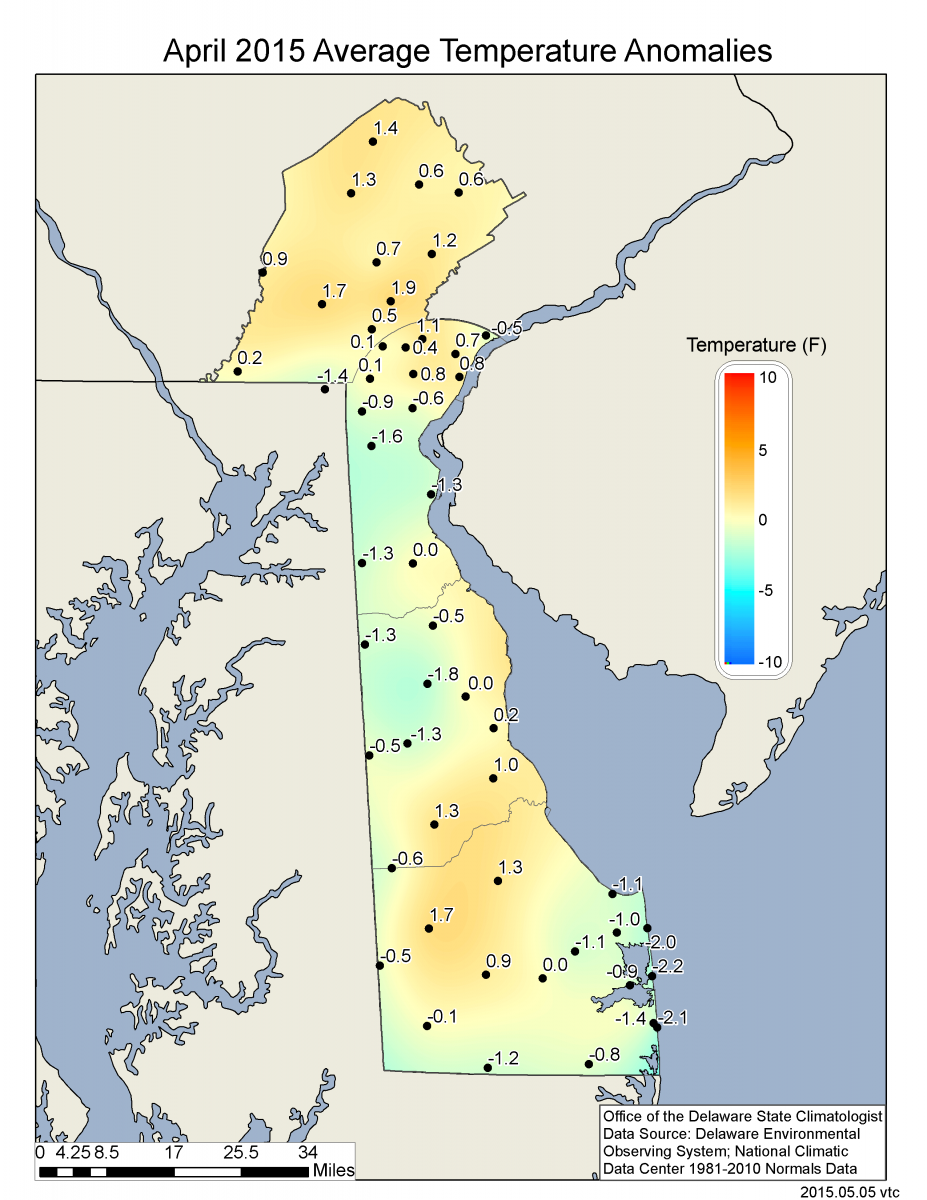
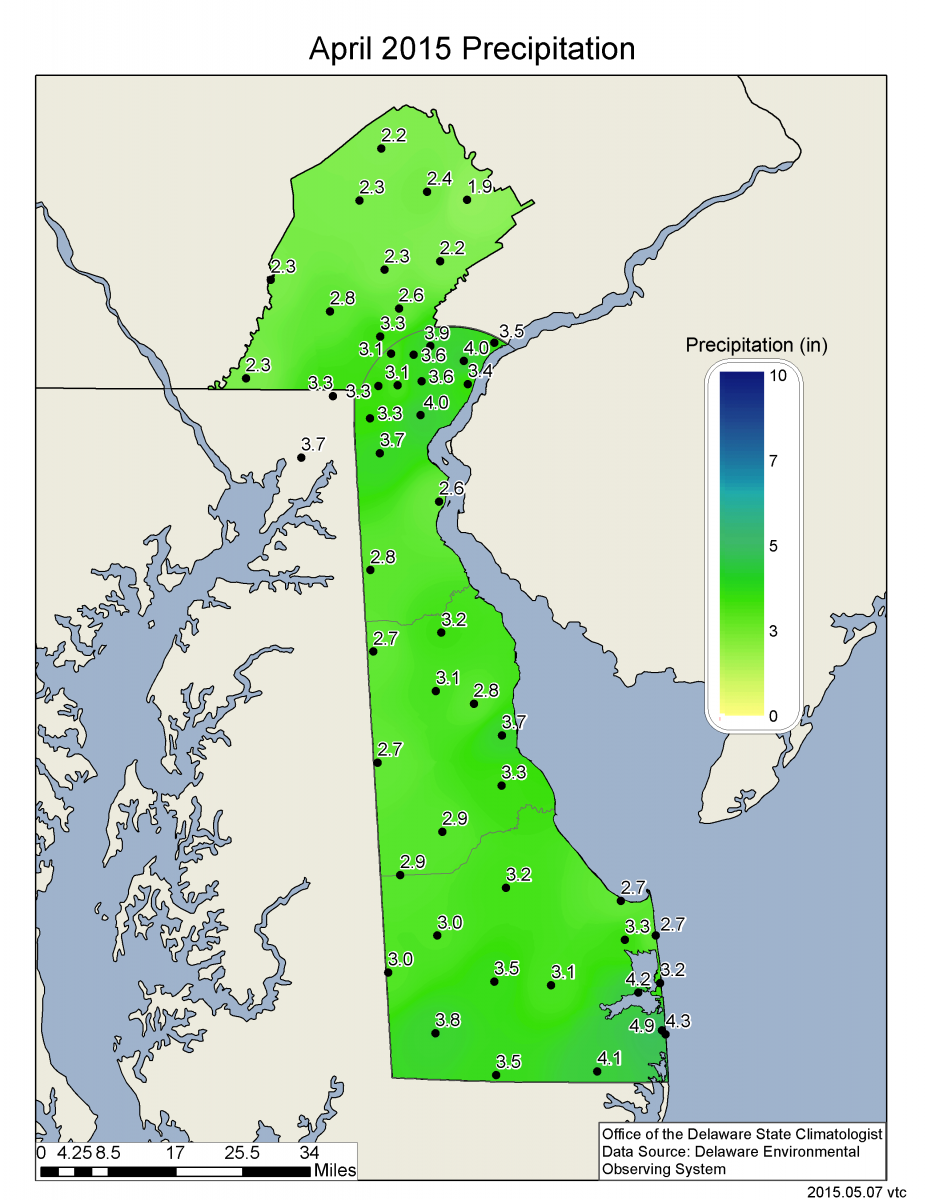
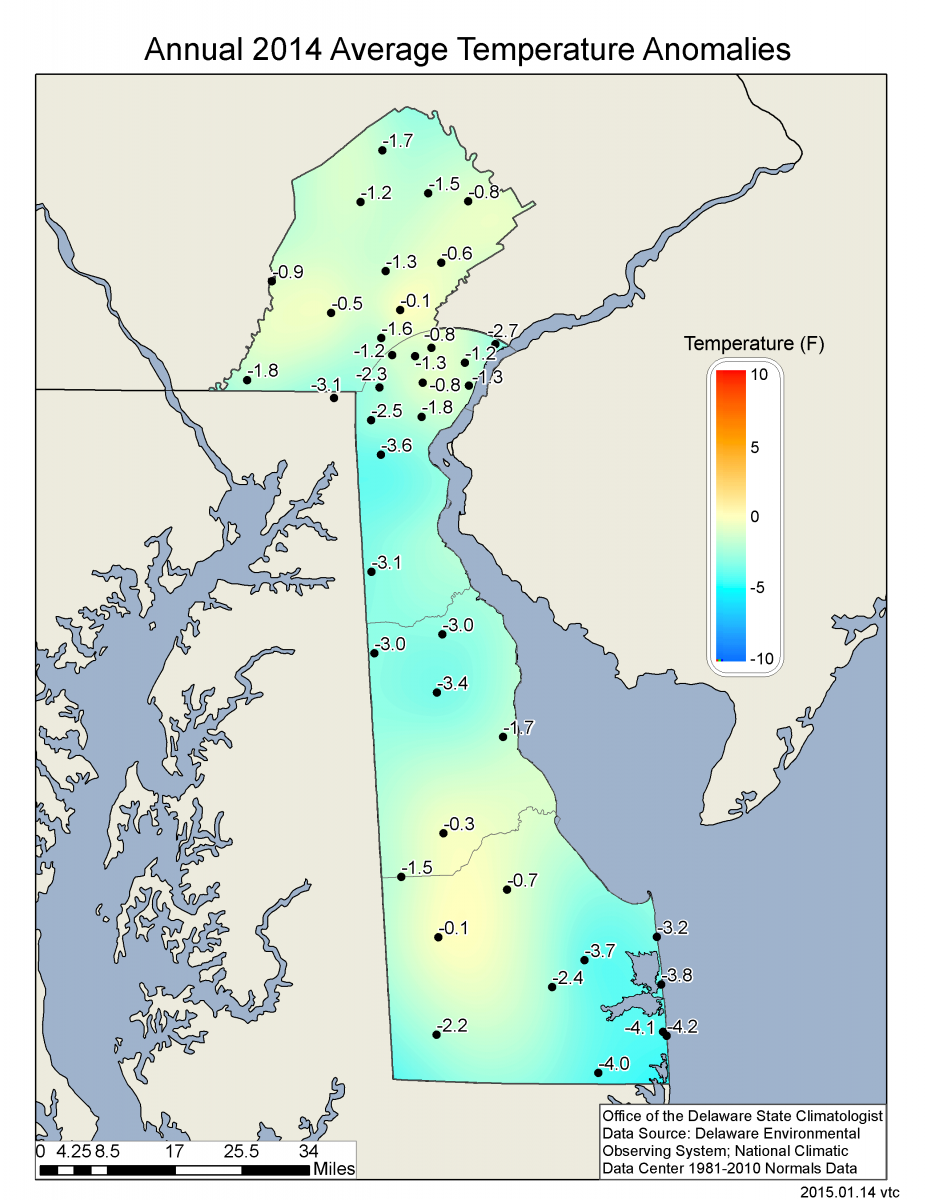
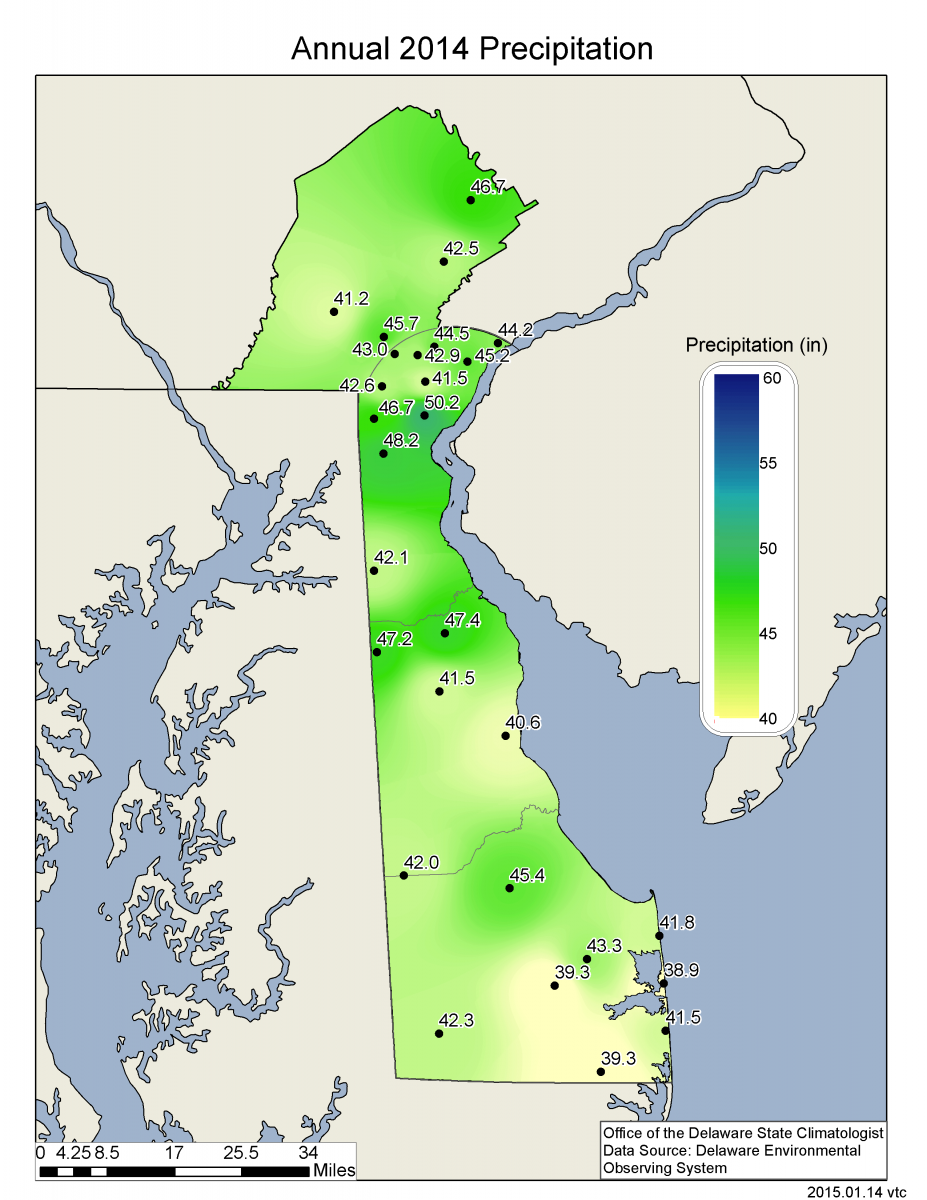
Data from the Delaware Environmental Observing System (DEOS) show that spring temperature anomalies across the State varied dependent upon location and were generally small at all stations (Figure 3). Spring precipitation totals were above normal across most of the State, with the largest positive anomalies found across Sussex County (Figure 4), where some stations recorded spring precipitation amounts more than six inches above average.
-
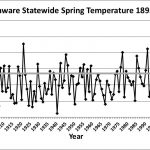
- Figure 1. Delaware statewide mean spring temperature (°F) 2018. Gray line indicates 1981-2010 normal.
-
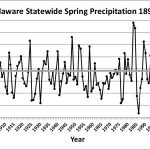
- Figure 2. Delaware statewide spring precipitation (inches) 1895-2018. Gray line indicates 1981-2010 normal.
-
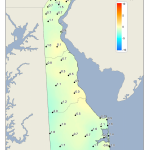
- Figure 3. Spring 2018 average temperature departures (°F) from the 1981-2010 mean based upon DEOS station data.
-
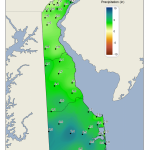
- Figure 4. Spring 2018 precipitation departures (inches) from the 1981-2010 mean based upon DEOS station data.