November Temperatures
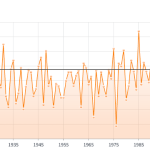
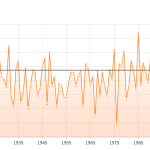
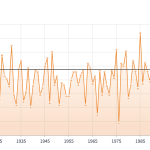
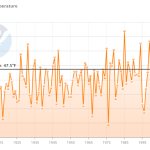
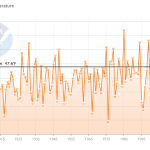
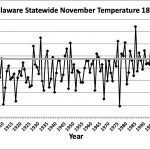
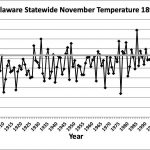
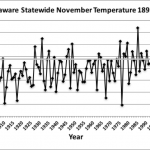
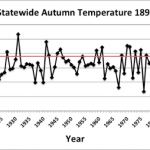
Preliminary data indicates that the statewide average temperature in November was 47.0o F, which is 0.5o F below the 1991-2020 mean value of 47.5o F (Figure 1). November 2025 was the 82nd warmest November in the last 131 years.
November Precipitation
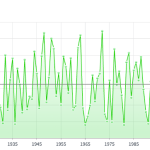
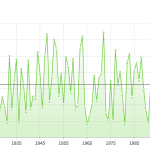
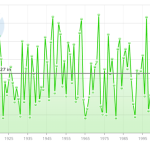
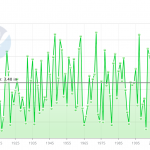
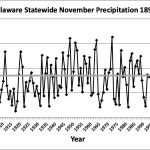
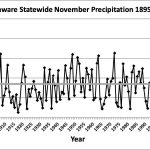
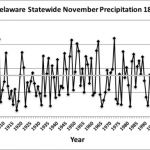
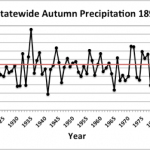
Delaware’s statewide precipitation for November 2025 averaged 1.61 inches, 1.66 inches below the 1991-2020 mean of 3.27 inches (Figure 2). November 2025 was tied with November 1990 as the 26th driest November since 1895.
Statewide Spatial Anomalies
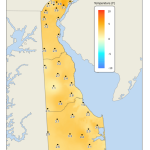
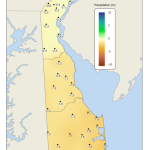
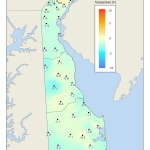
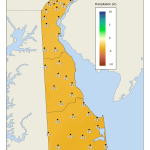
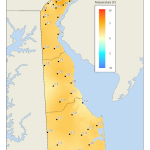
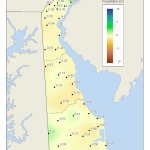
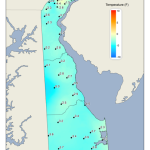
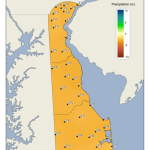
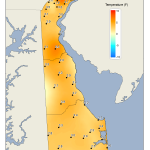
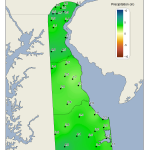
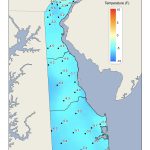
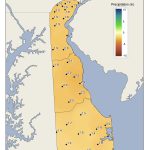
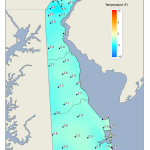
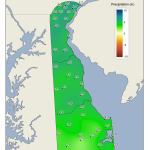
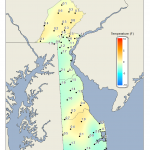
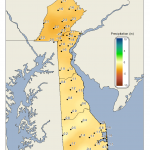
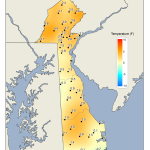
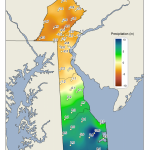
Data from the Delaware Environmental Observing System (DEOS) show that temperatures were generally below normal across the entire State except for extreme northern Delaware (Figure 3). Precipitation was uniformly below normal, with the largest negative departures found across Kent and Sussex Counties (Figure 4).
National Anomalies
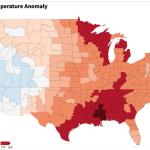
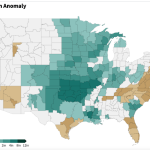
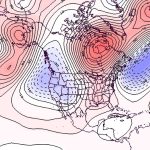
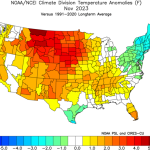
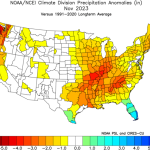
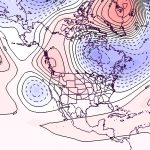
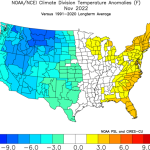
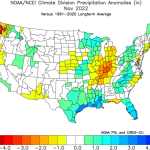
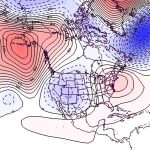
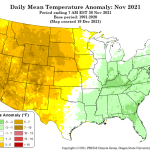
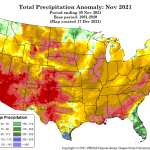
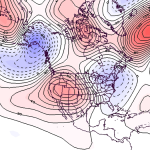
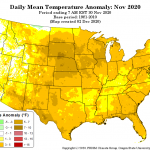
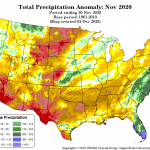
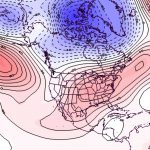
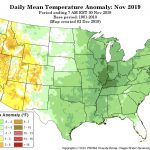
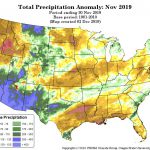
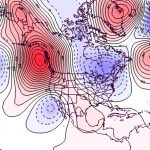
Temperatures were above normal across the western two-thirds of the country with positive anomalies reaching to between 7 – 9 o F across portions of the Rockies and much of Texas (Figure 5). Precipitation was generally below normal in the eastern one-half of the nation, especially along the Gulf Coast. Southern California, Arizona, and parts of Nevada saw above normal precipitation during the month (Figure 6). The 500 hPa height pattern for November showed an anomalous jet stream ridge covering the western half of the United States (Figure 7) contributing to the temperature anomalies across the country.
Global Anomalies
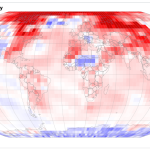
November 2025 ranked as the third-warmest November on record for the globe since 1850. Global temperatures were 2.12o F (1.18o C) above the 1901-2000 mean. Particular warmth was found across much of the Arctic, central North America, and western Russia (Figure 8).
-
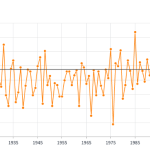
- Figure 1. Delaware statewide mean November temperature (oF) 1895-2025. The black line indicates the 1991-2020 normal (NOAA, NCEI, Climate at a Glance: Statewide Time Series).
-
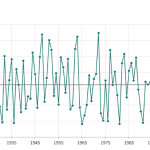
- Figure 2. Delaware statewide November precipitation (inches) 1895-2025. The Black line indicates the 1991-2020 normal (NOAA, NCEI, Climate at a Glance: Statewide Time Series).
-
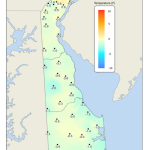
- Figure 3. November 2025 average temperature departures (degrees F) from the 1991-2020 mean based upon DEOS station data.
-
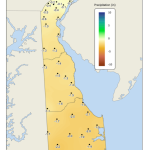
- Figure 4. November 2025 precipitation departures (inches) from the 1991-2020 mean based upon DEOS station data.
-
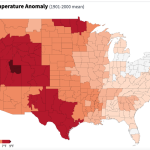
- Figure 5. United States climate division temperature anomalies (degrees F) for November 2025 (NOAA, NCEI, Climate at a Glance: Divisional Mapping).
-
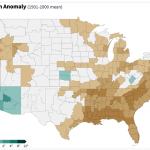
- Figure 6. United States climate division precipitation anomalies (inches) for November 2025 (NOAA, NCEI, Climate at a Glance: Divisional Mapping).
-
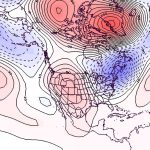
- Figure 7. 500 hPa geopotential height anomalies for November 2025. Negative (blue) anomalies indicate the presence of an anomalous jet stream trough while positive (red) height anomalies indicate the presence of an anomalous jet stream ridge.
-
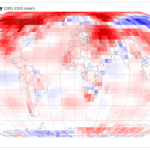
- Figure 8. Global temperature anomalies (degrees C) for November 2025 (NOAA, NCEI, Climate at a Glance: Global Mapping).