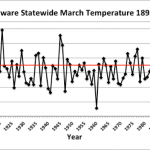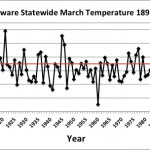
March Temperatures
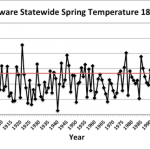
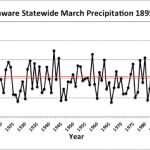
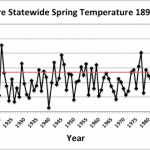
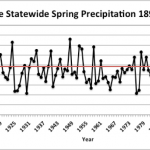
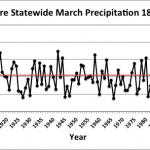
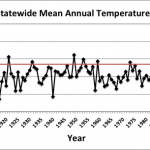
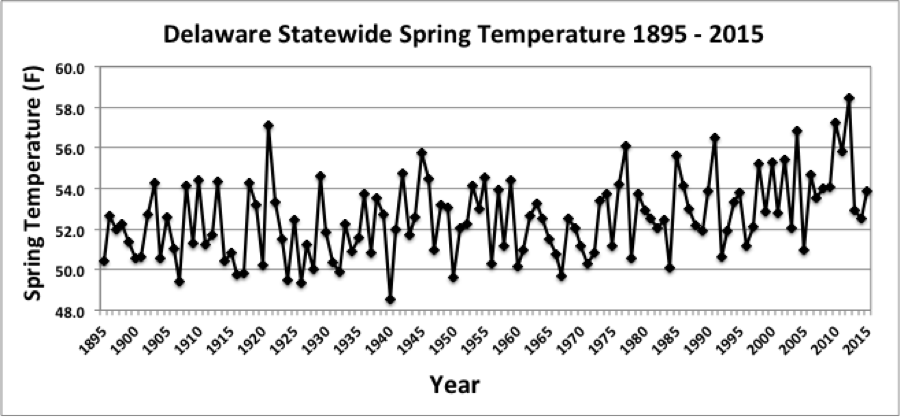
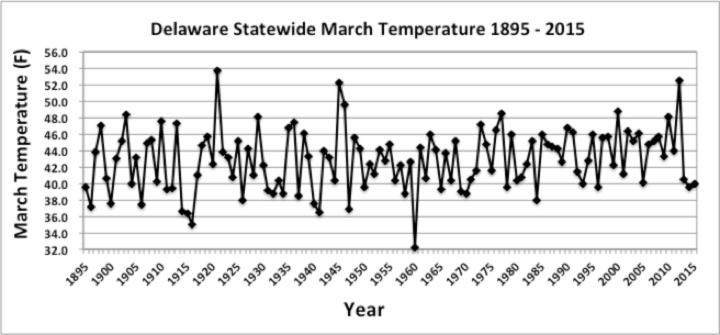
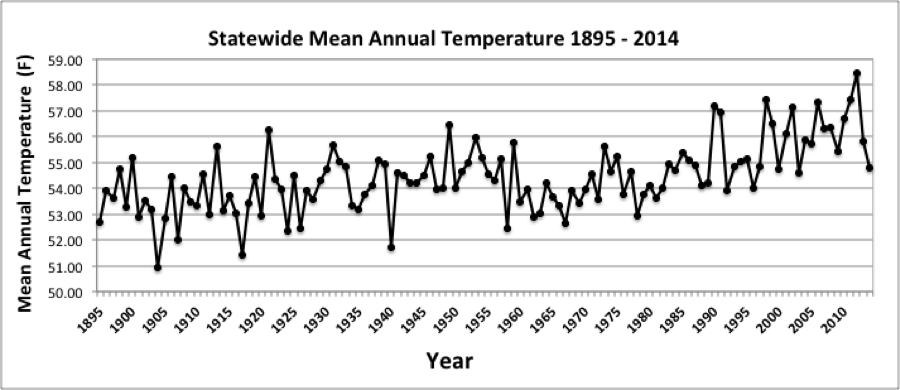
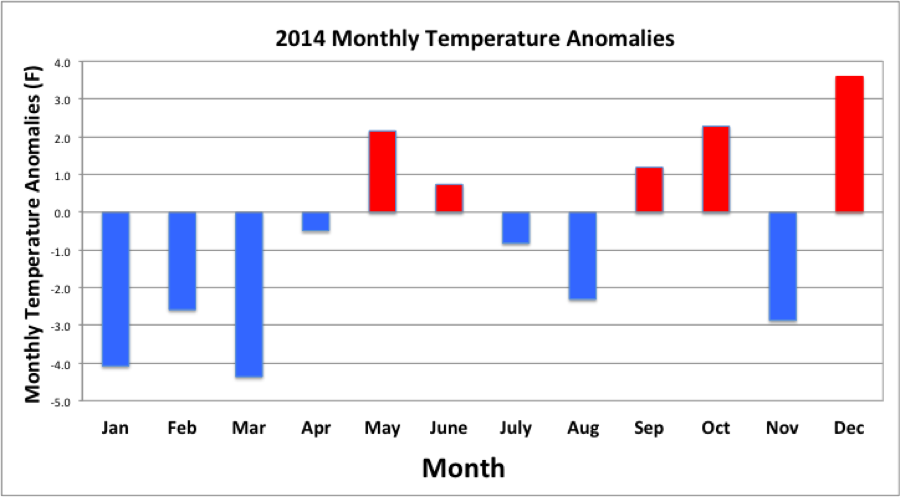
Preliminary data indicates that the statewide average temperature in March was 40.6°F, which is 3.4°F below the 1981-2010 mean value of 44.0°F (Figure 1). March 2018 was 2.3°F colder than March (an unusual occurrence) and was the 40th coolest March since 1895. Much of the mid-Atlantic region of the United States was also colder than normal during the month, especially across portions of Virginia and North Carolina (Figure 2).
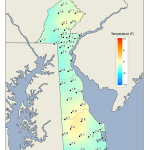
March Precipitation
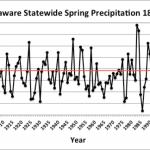
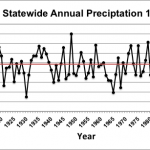
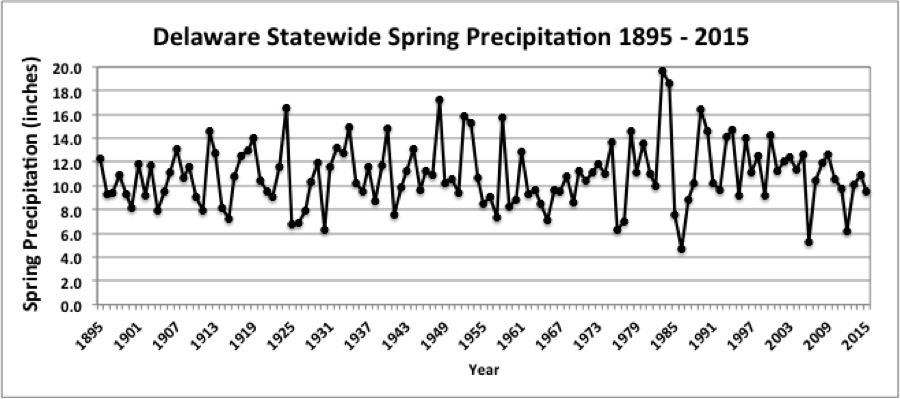
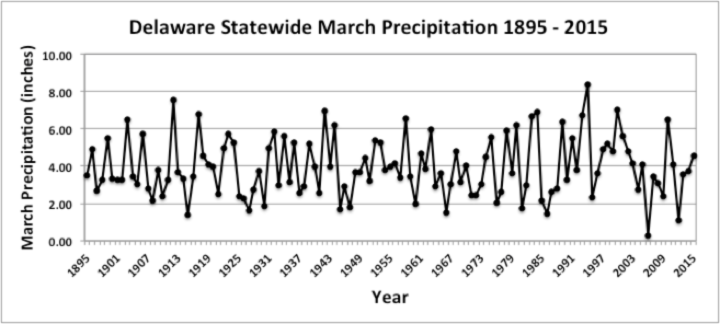
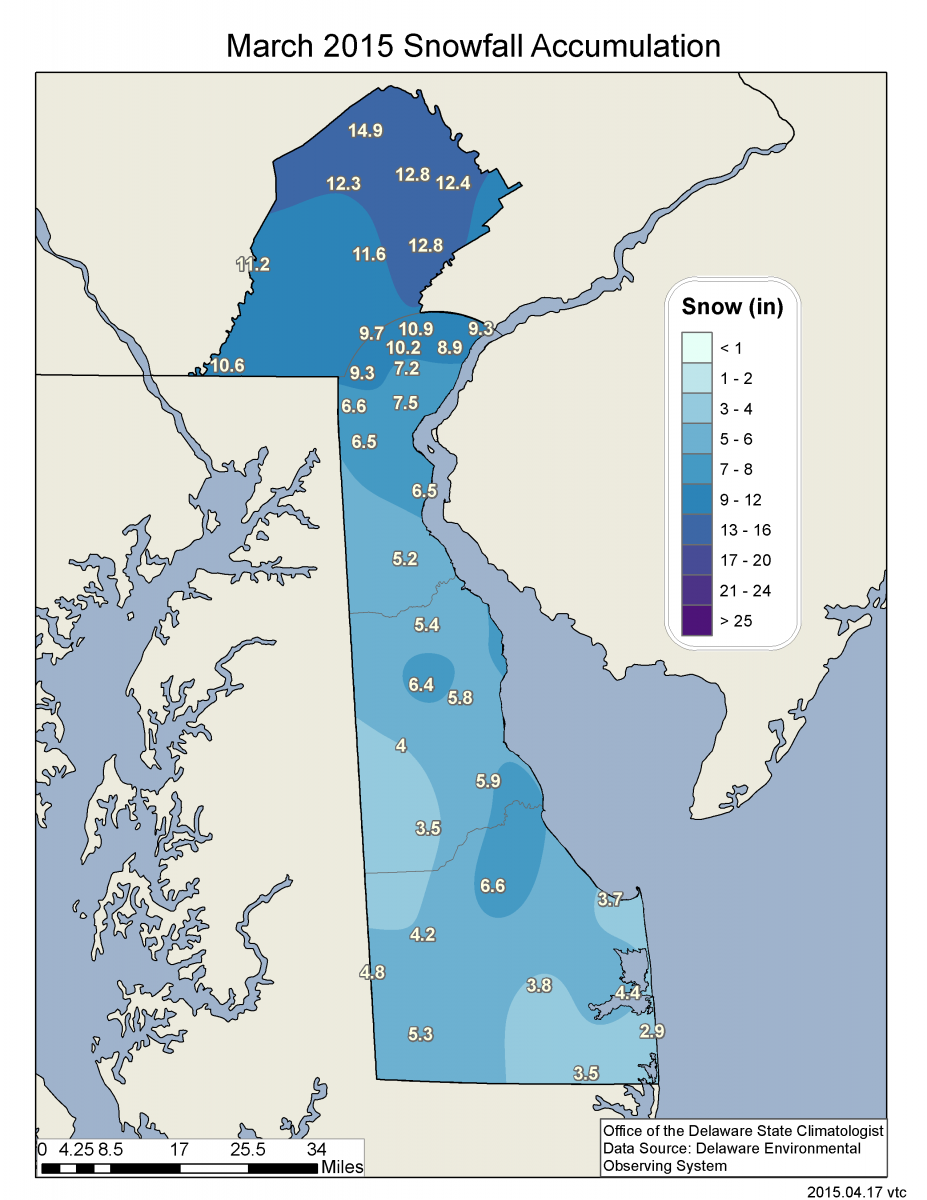
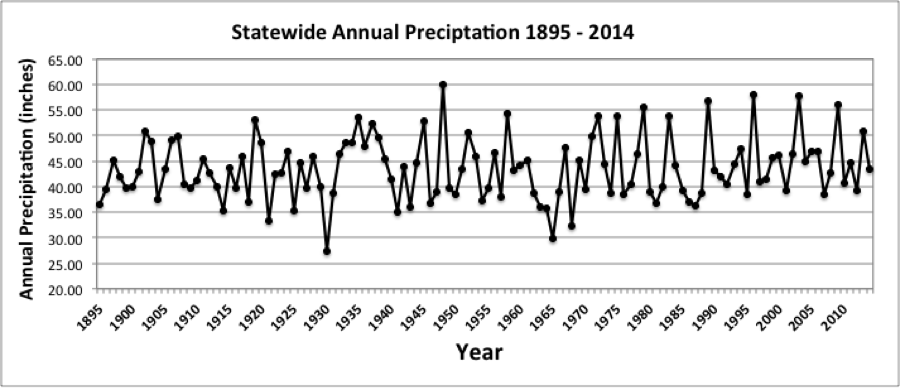
Delaware’s statewide precipitation for March 2018 averaged 3.89 inches, 0.31 inches below the 1981-2010 mean (Figure 3). Even though total precipitation was below normal, much of the precipitation that did fall fell as snow due to the cold March temperatures. During the month 14.2 inches of snow fell at the Wilmington – New Castle County Airport . This was 11 inches above the March average snowfall of 3.2 inches, and the 2nd largest March total since snowfall records began in 1948.
Statewide Spatial Averages
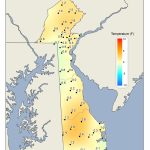
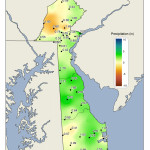
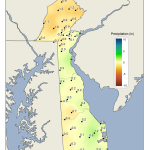
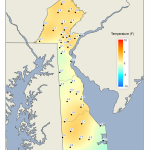
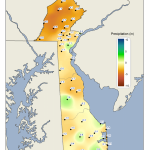
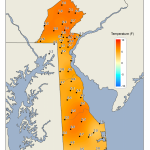
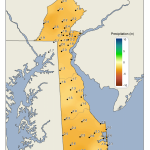
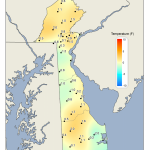
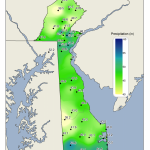
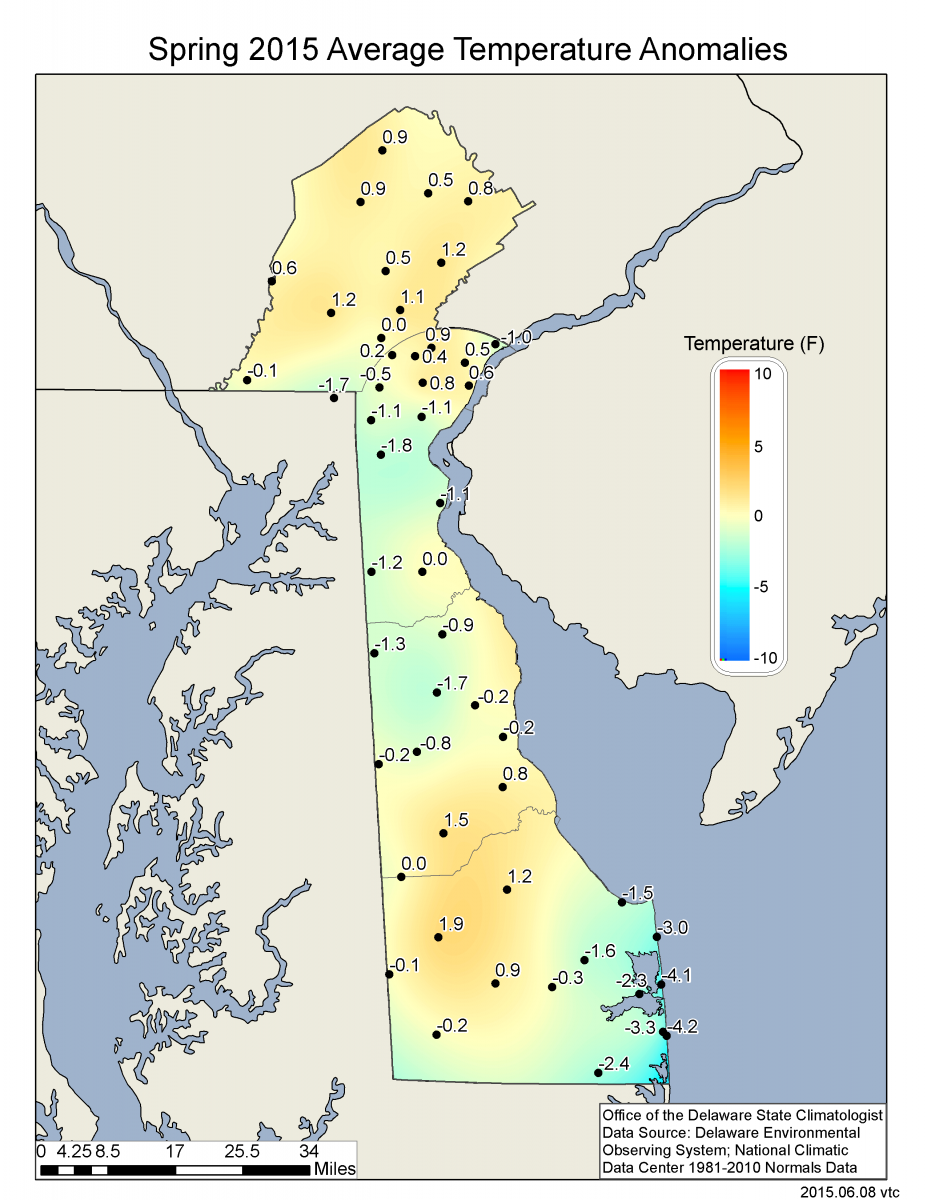
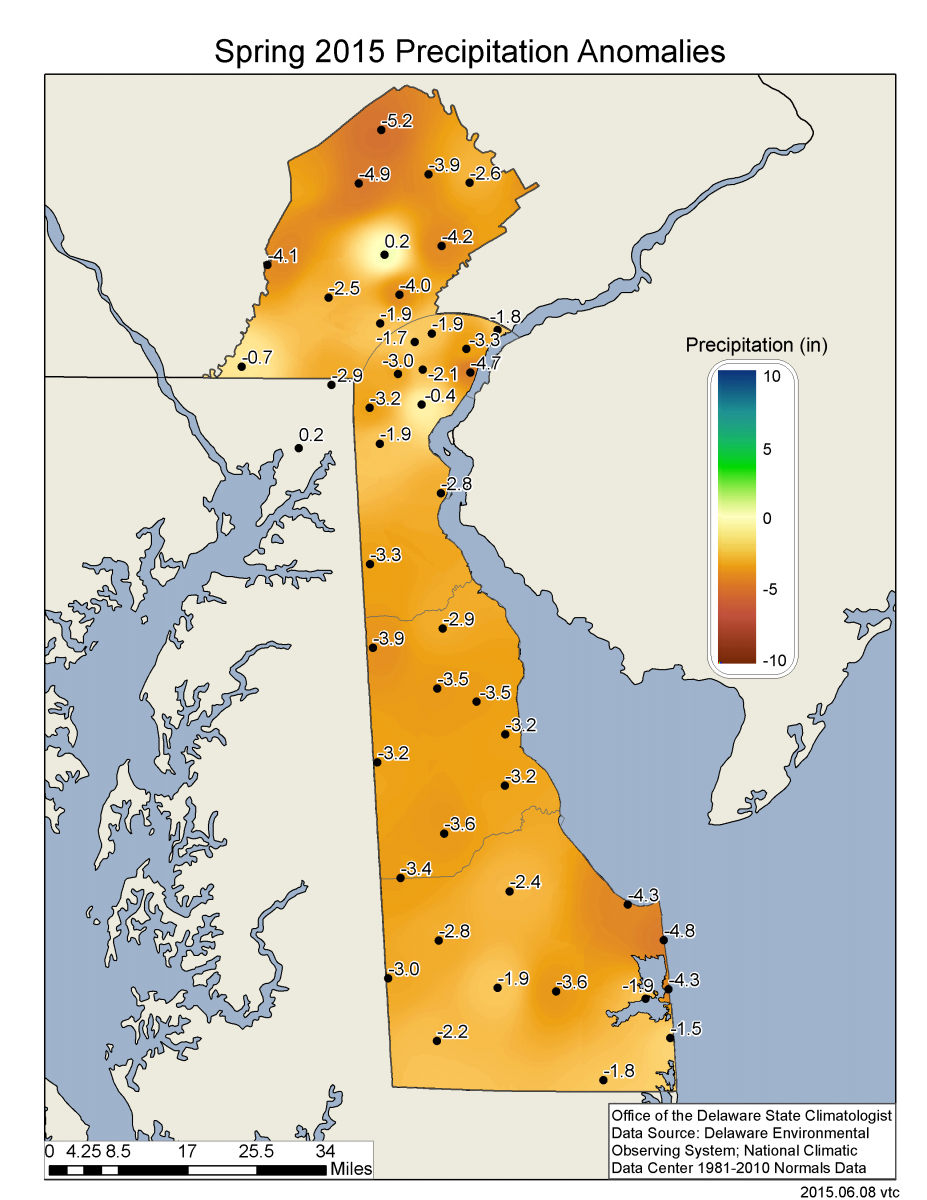
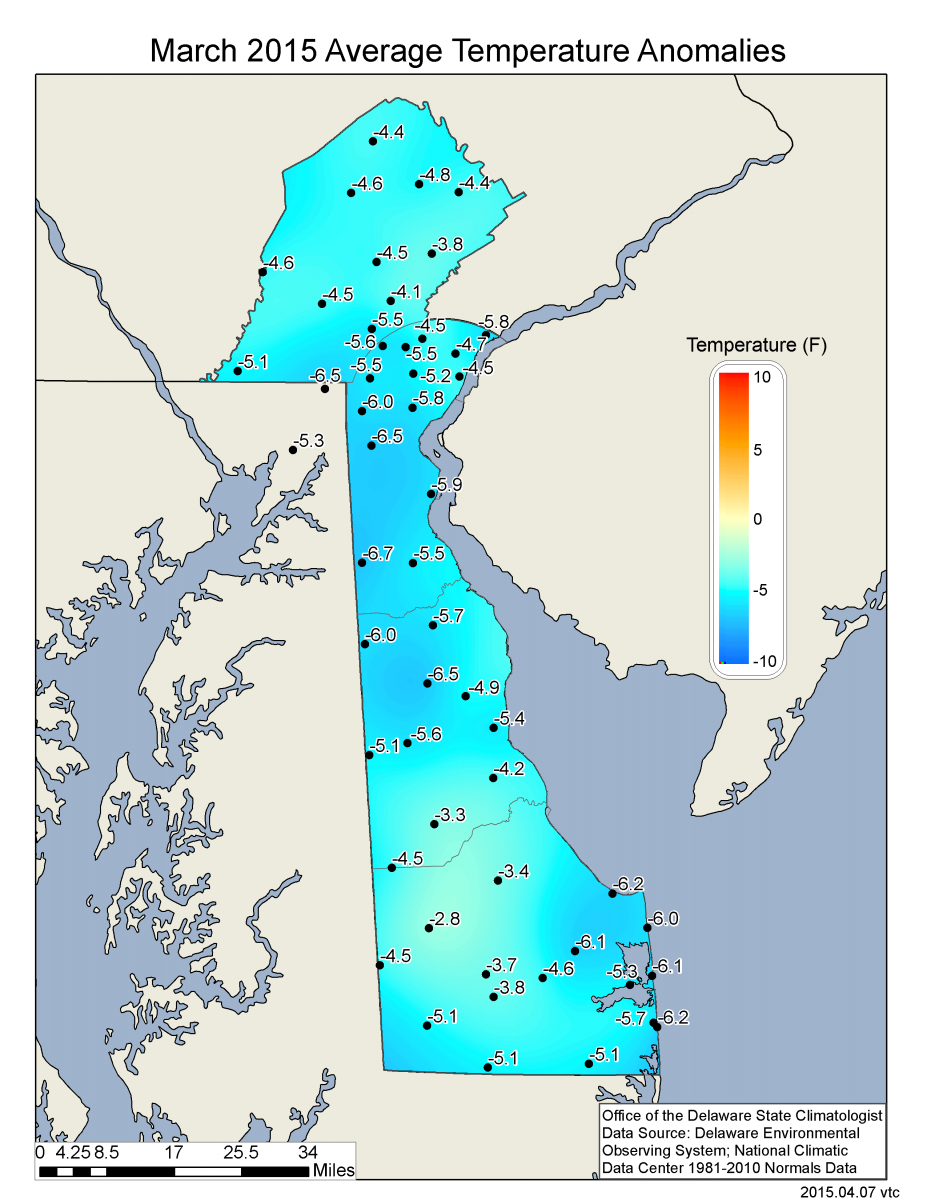
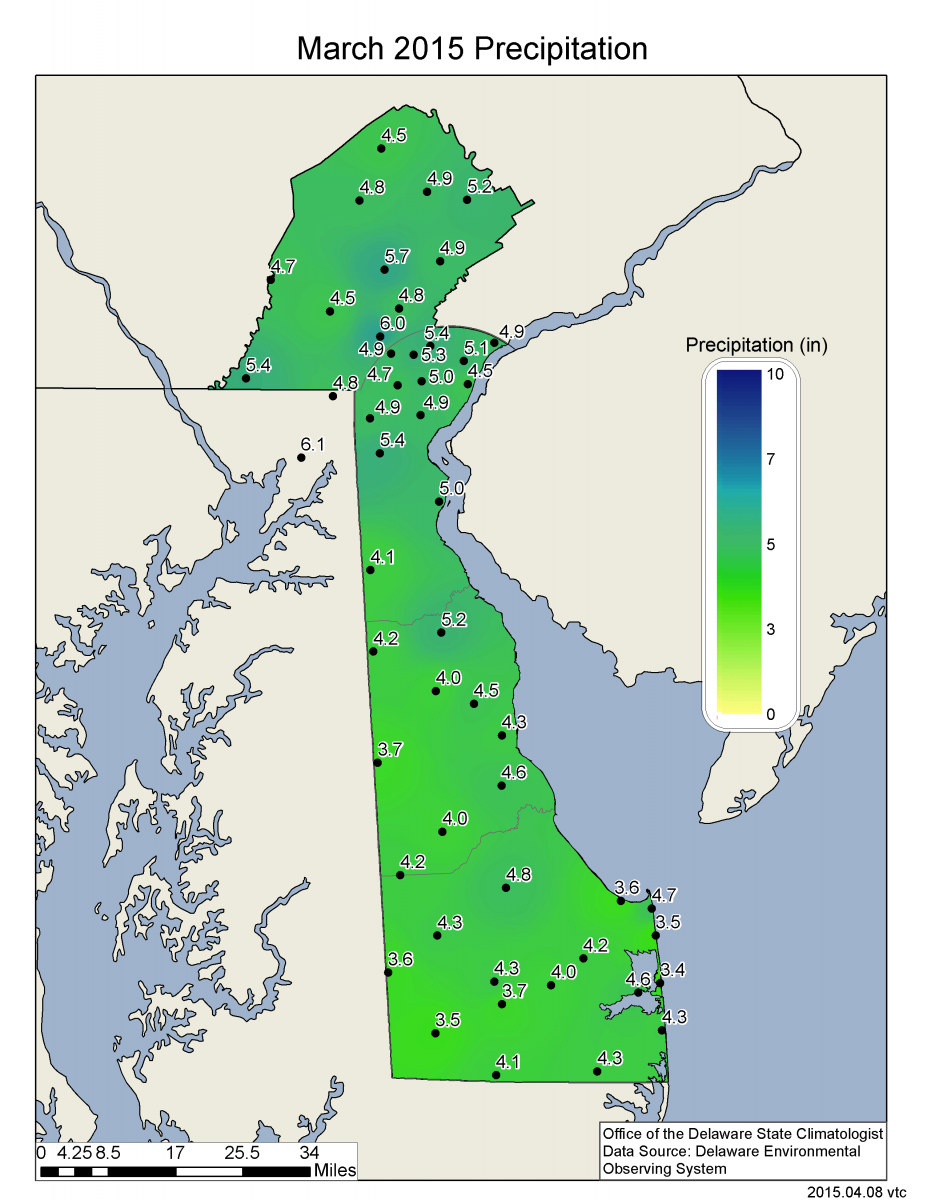
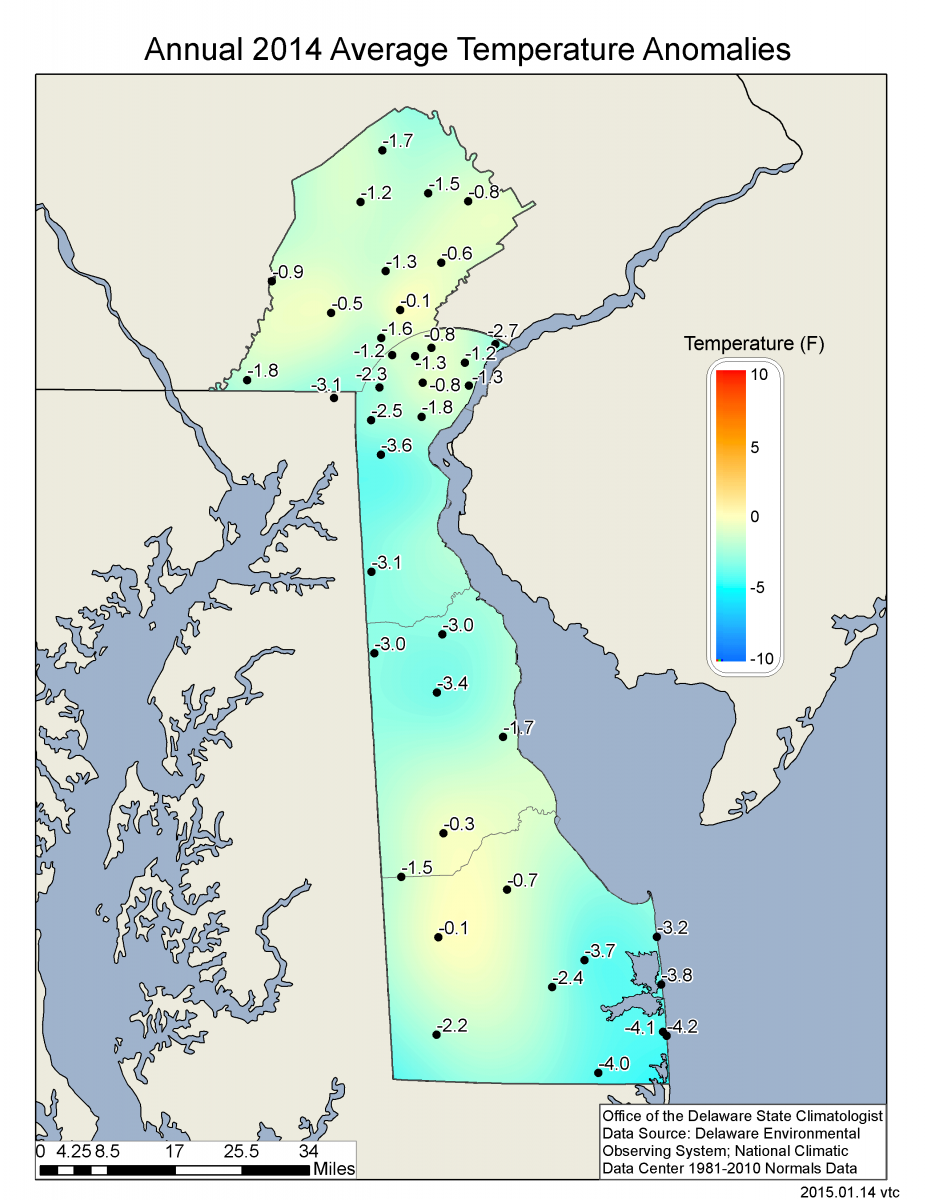
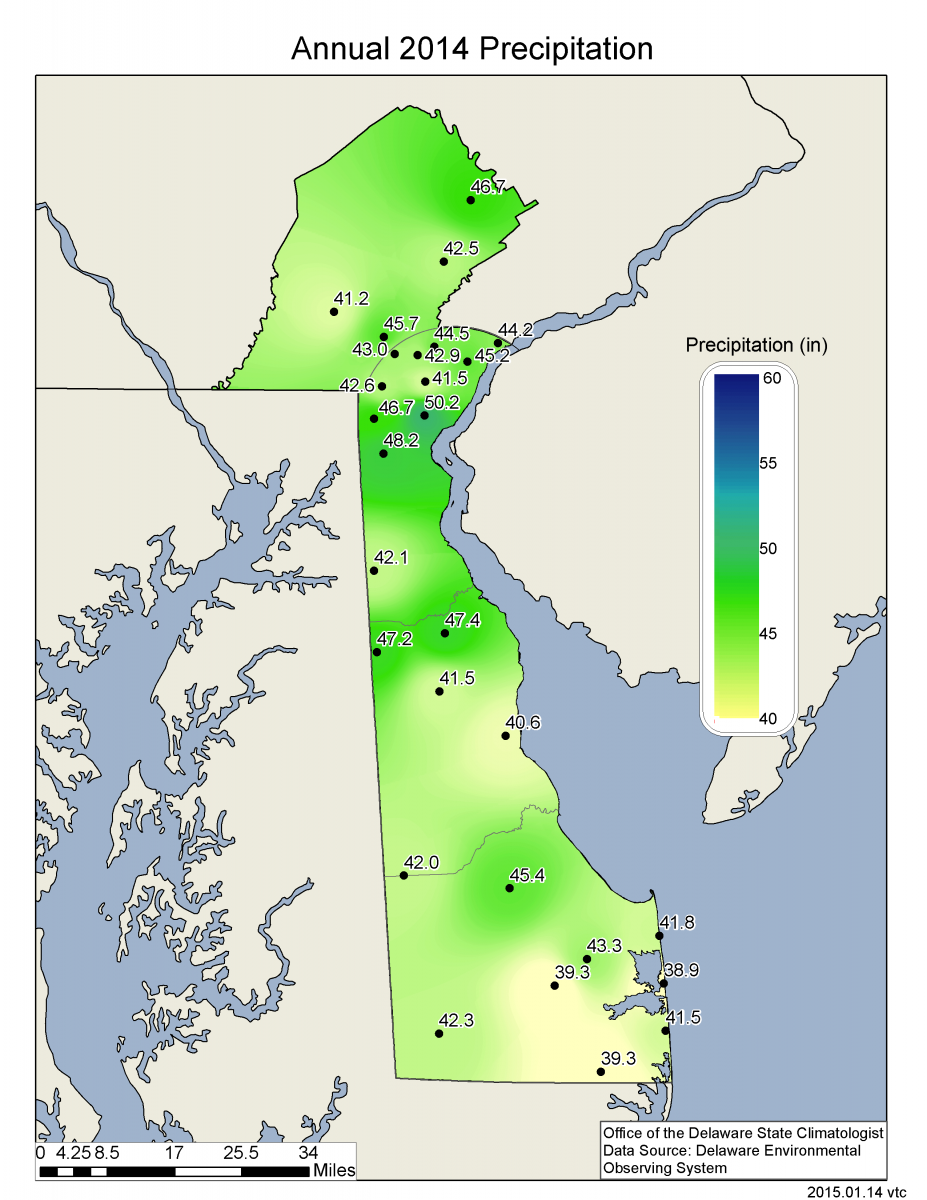
Data from the Delaware Environmental Observing System (DEOS) show that temperature departures were below normal across the entire State (Figure 4), with the greatest anomalies of over 5°F found across Sussex County. Precipitation departures were just below, or just above normal at all stations (Figure 5), with most stations seeing departures of 1 inch or less.
-
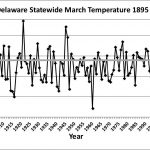
- Figure 1. Delaware statewide mean March temperature (°F) 1895-2018. Light gray line indicates 1981-2010 normal.
-
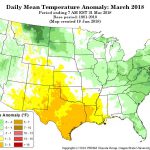
- Figure 2. National daily mean temperature anomalies for March 2018 (from the PRISM Climate Group, OSU).
-
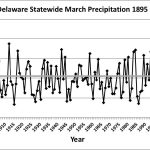
- Figure 3. Delaware statewide March precipitation (inches) 1895-2018. Light gray line indicates 1981-2010 normal.
-
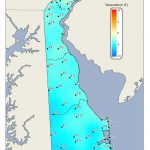
- Figure 4. March 2018 average temperature departures (°F) from the 1981-2010 mean based upon DEOS station data.
-
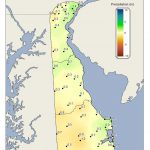
- Figure 5. March 2018 precipitation departures (inches) from the 1981-2010 mean based upon DEOS station data.