August Temperatures
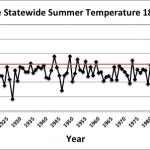
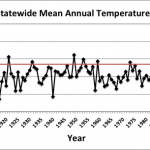
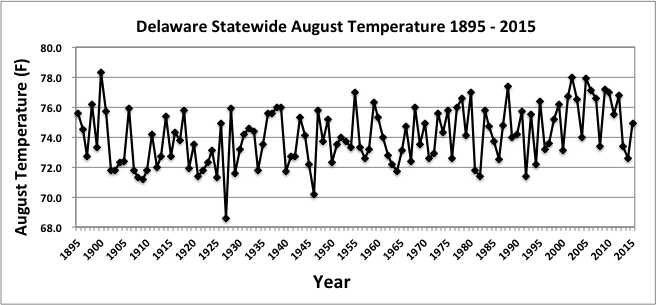
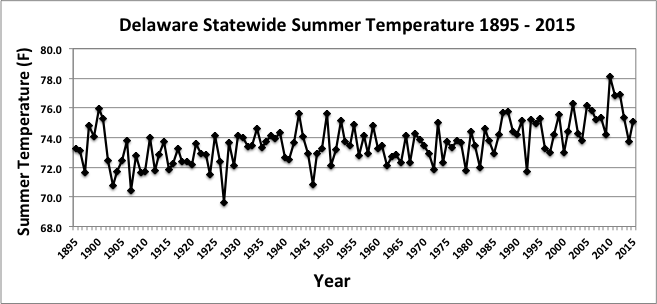
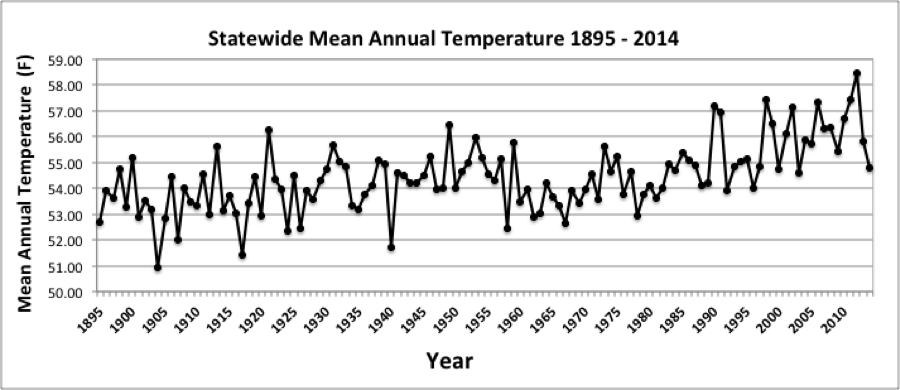
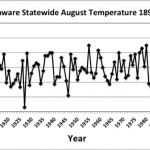
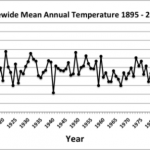
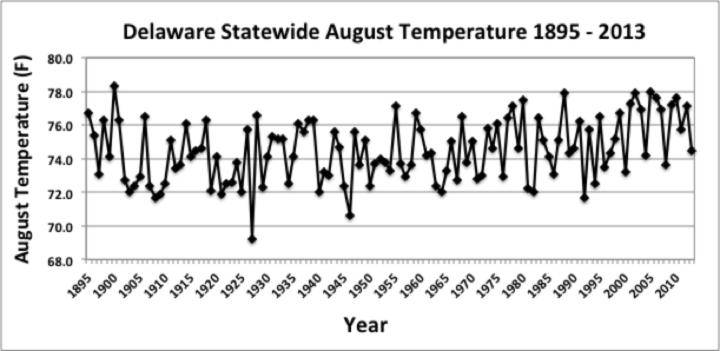
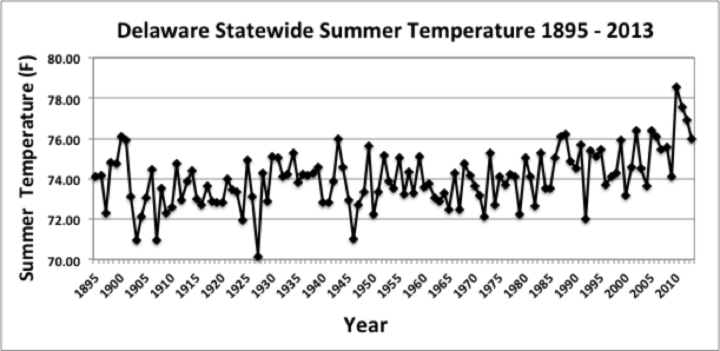
Preliminary data indicates that the statewide average temperature in August was 78.7°F, 3.8°F above the 1981-2010 normal of 74.9°F (Figure 1). August 2016 ranks as the warmest August since records began in 1895. August’s extreme warmth follows the 5th warmest August on record. The Wilmington/New Castle County Airport recorded 15 days with temperatures greater than or equal to 90°F during the month, 10 days more than the long-term mean.
August Precipitation
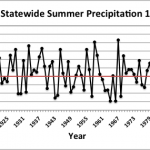
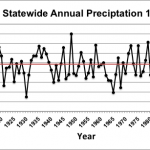
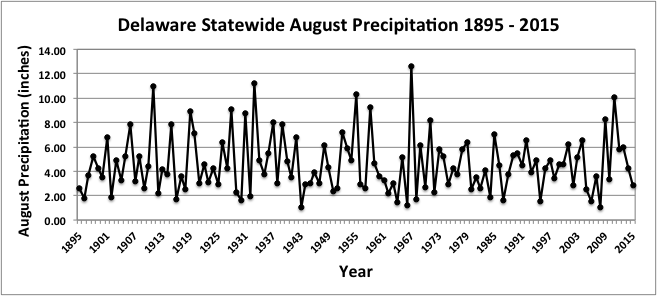
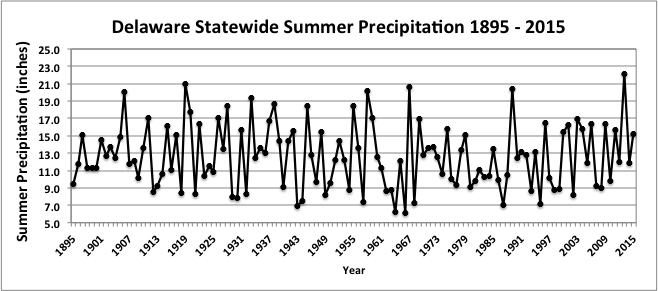
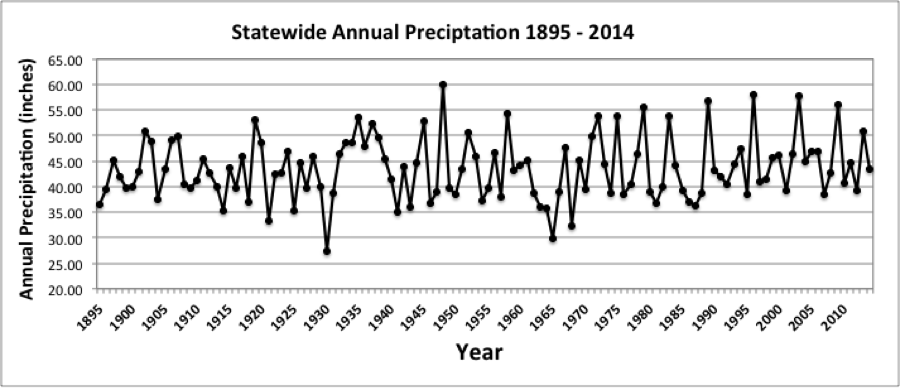
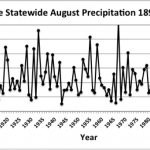
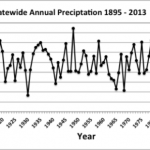
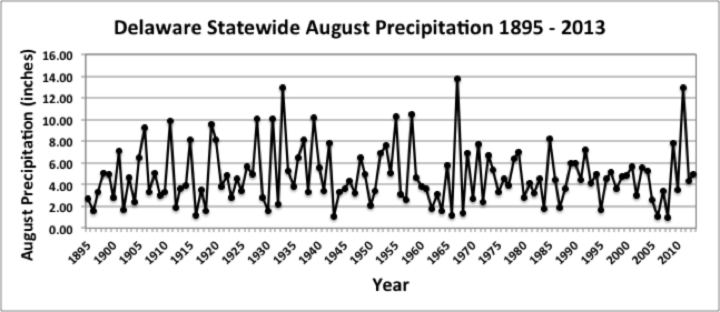
Delaware’s statewide precipitation for August 2016 averaged 3.21 inches, 0.91 inches below the 1981-2010 mean of 4.12 inches (Figure 2). The combination of low precipitation and high temperatures resulted in dry conditions in many parts of the State by the end of the month.
Statewide Spatial Averages
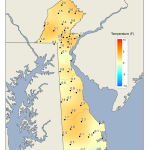
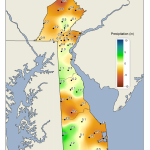
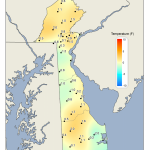
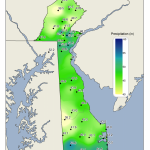
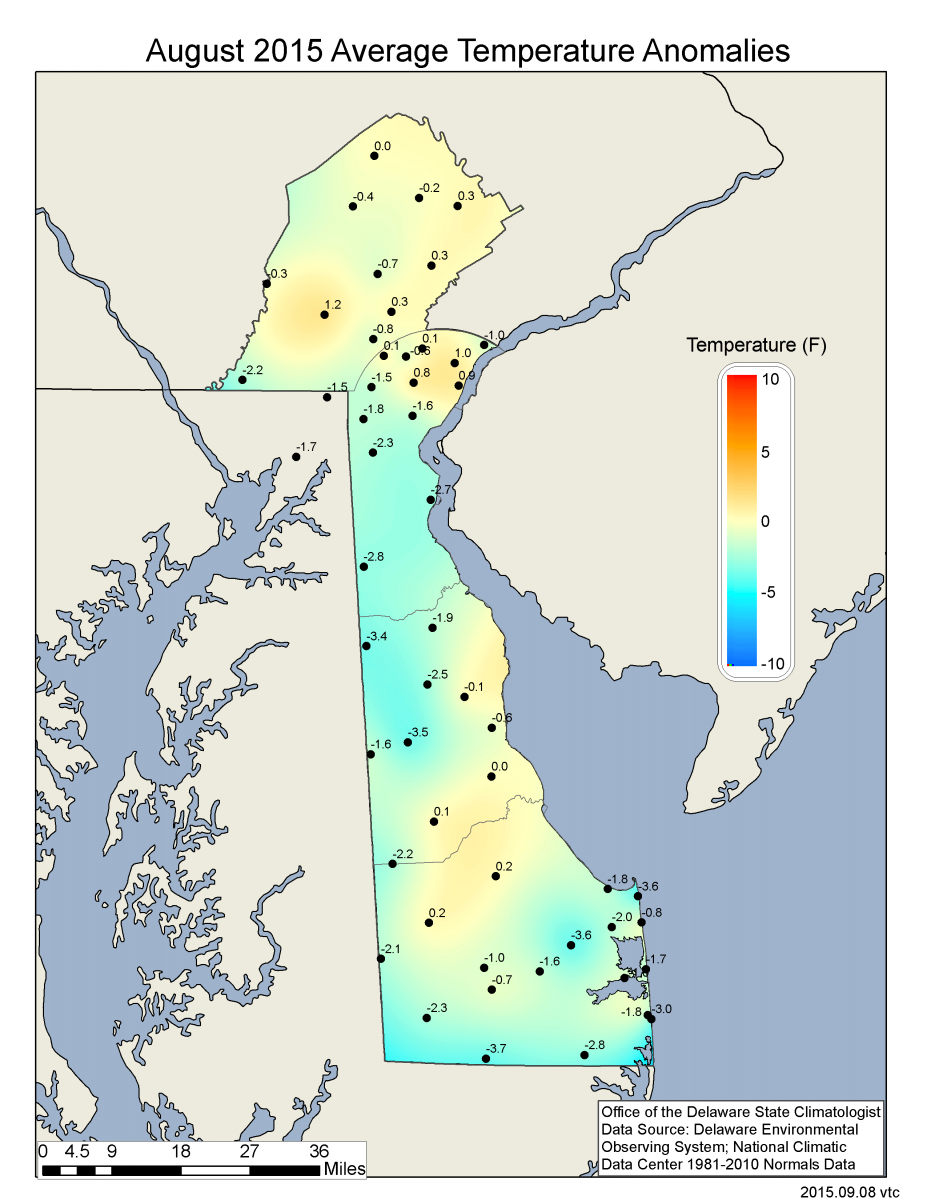
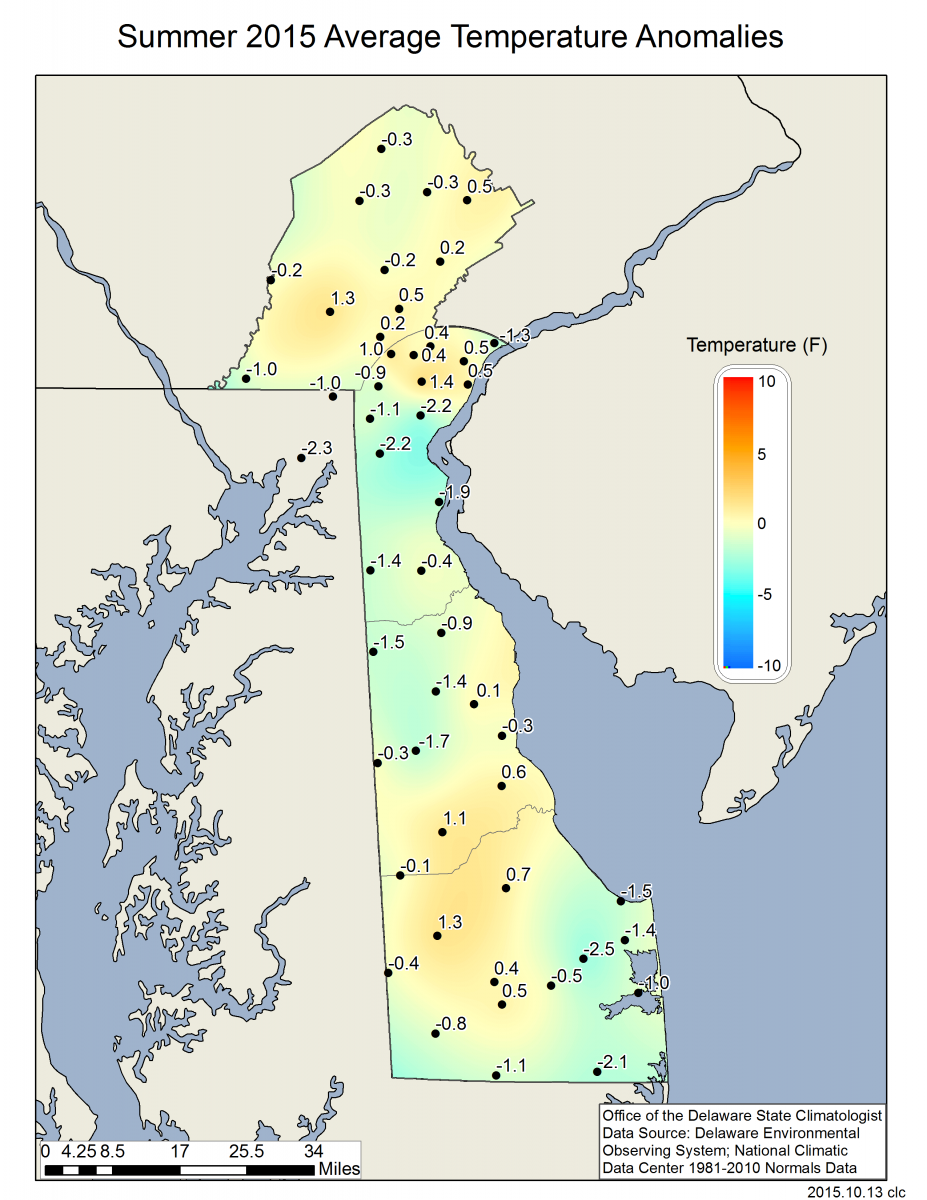
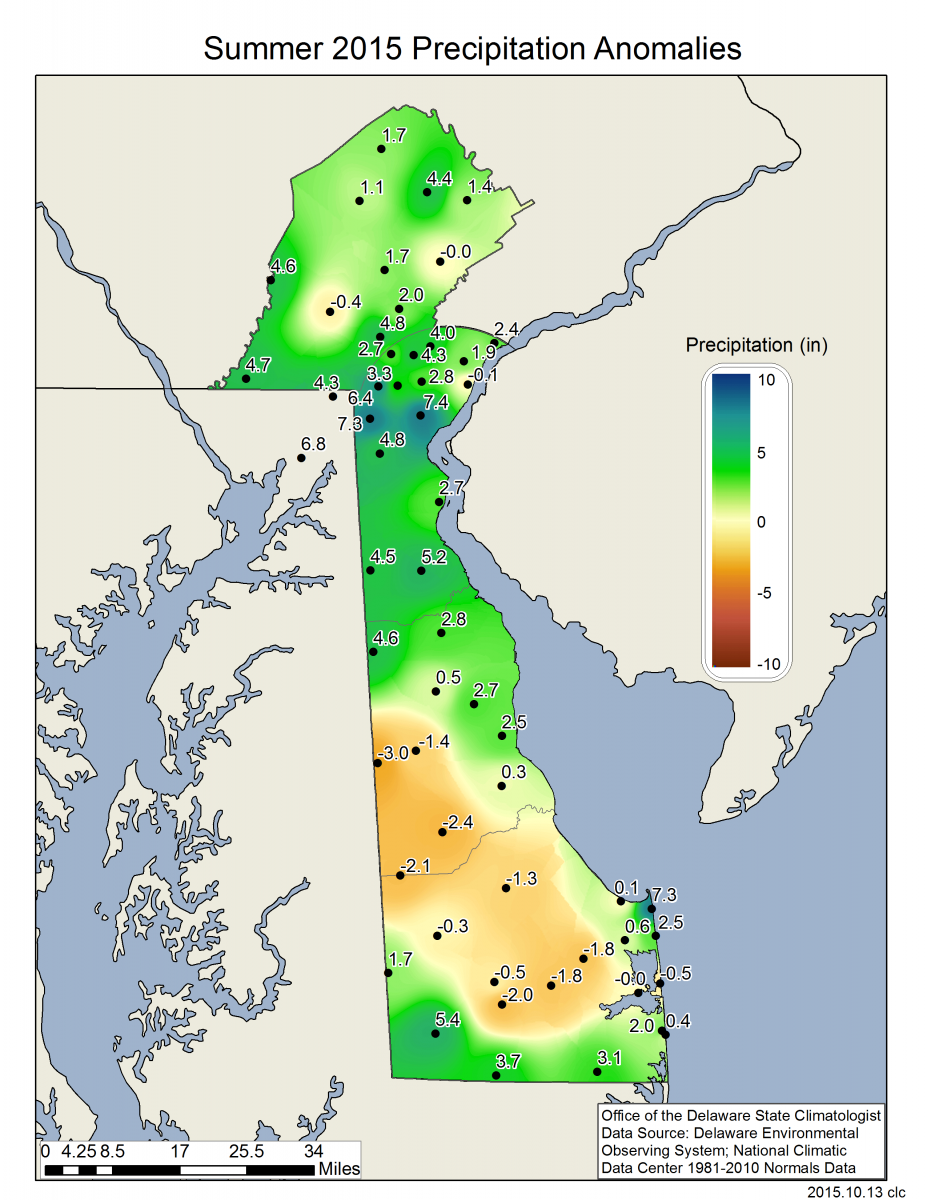
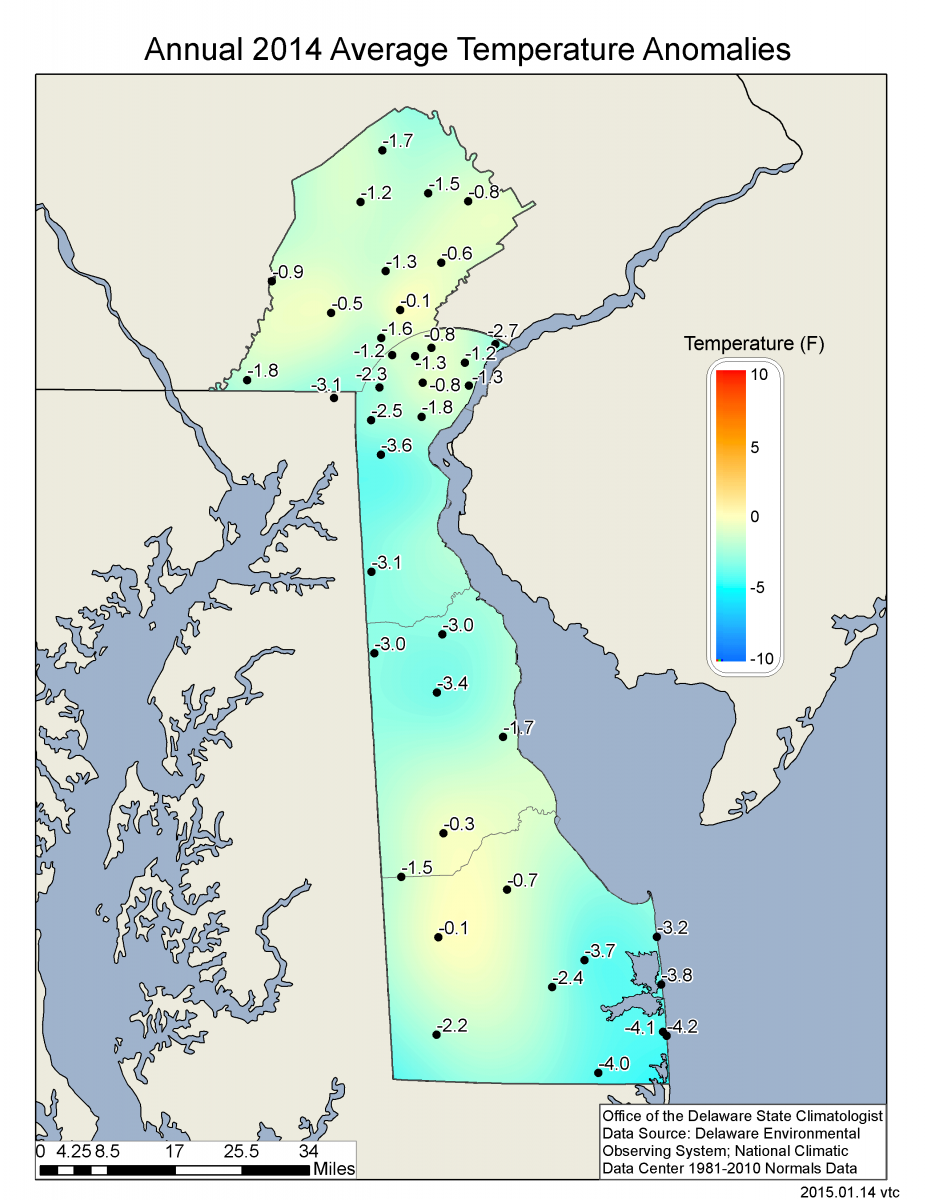
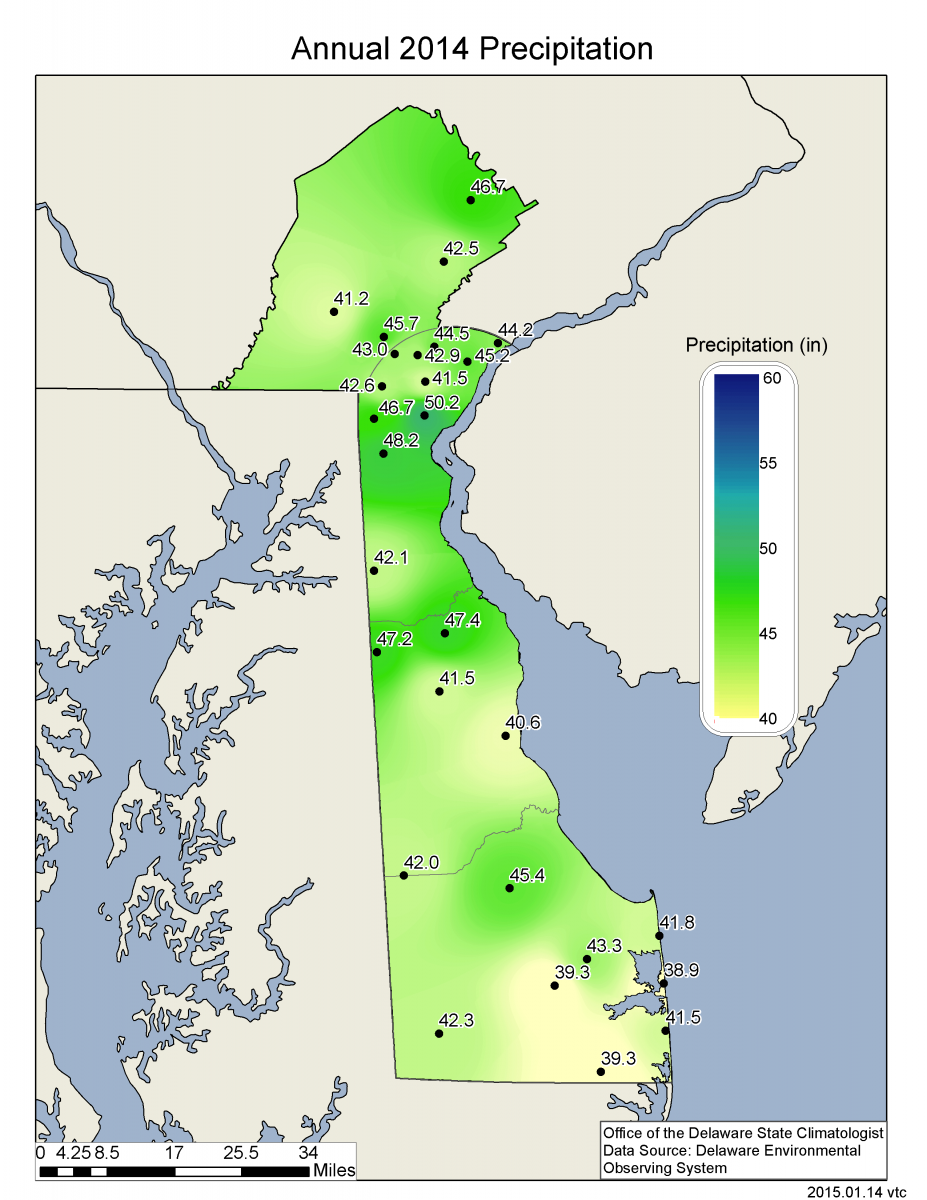
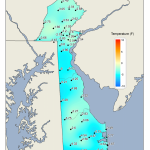
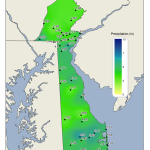
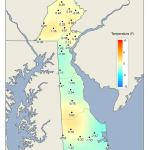
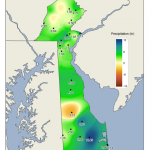
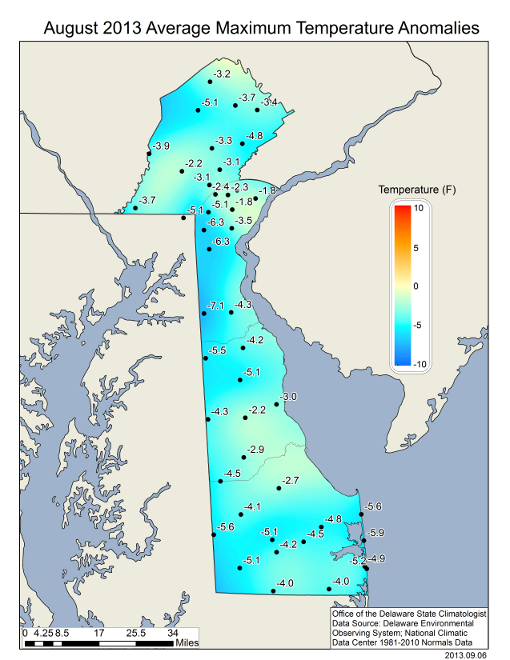
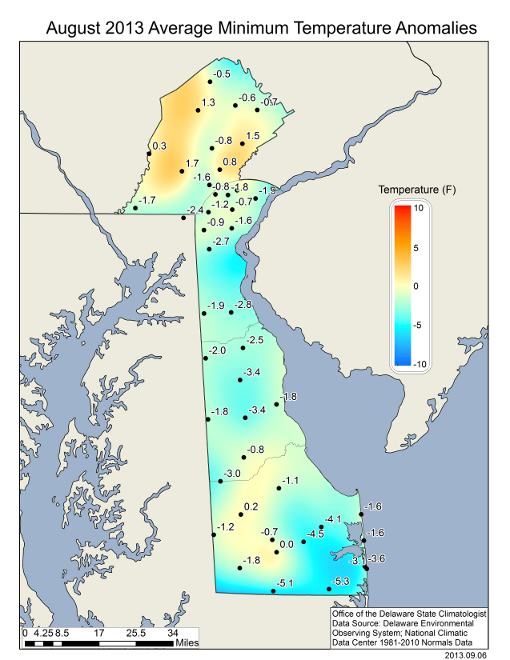
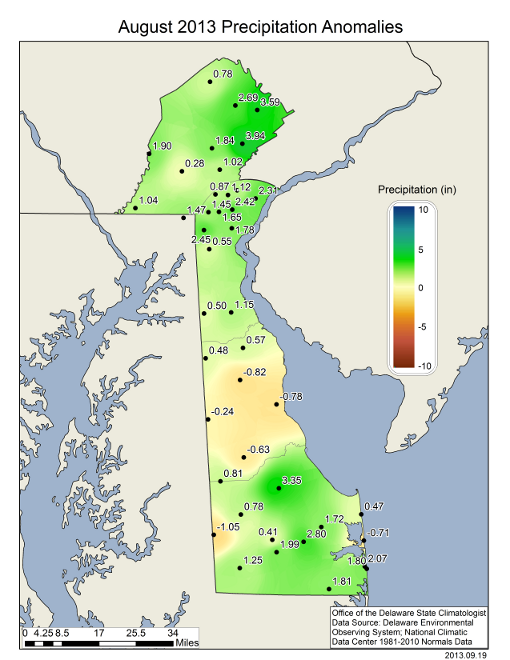
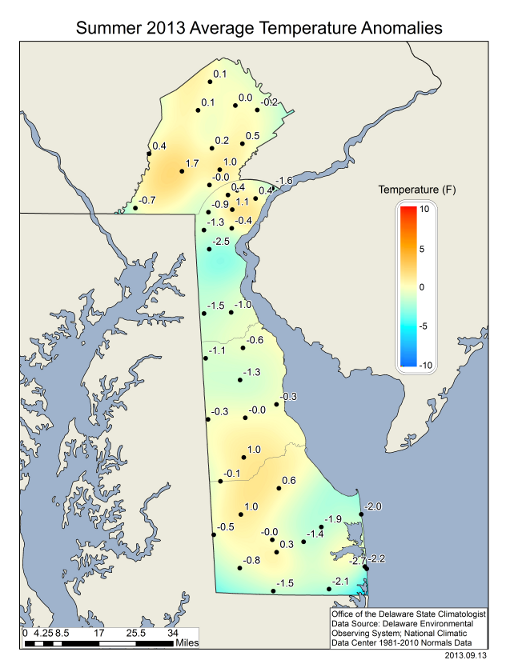
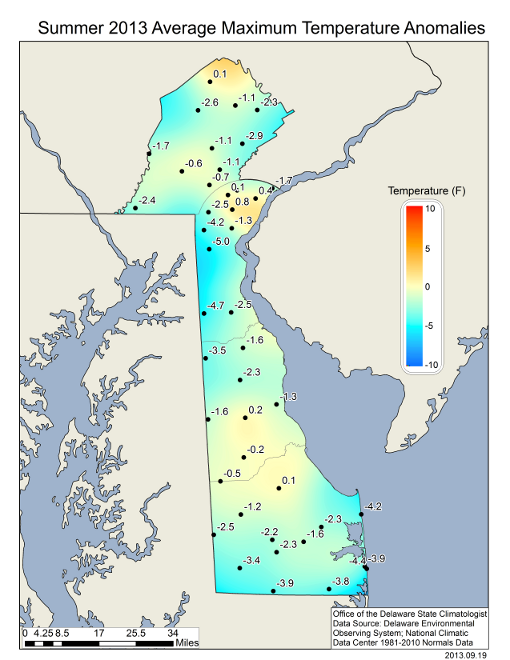
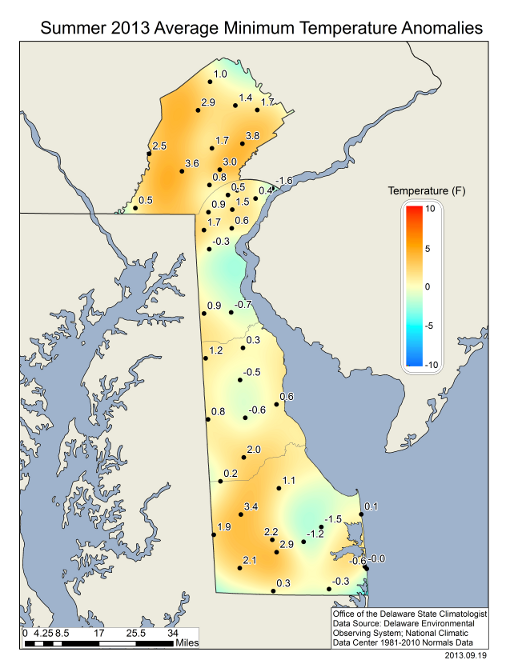
Data from the Delaware Environmental Observing System (DEOS) show that temperatures were above normal at nearly every station across the State, with the largest temperature anomalies found across northern New Castle County, and Chester County, PA (Figure 3). Precipitation was below normal across most of the State, with a few stations showing near normal or above normal precipitation totals due to isolated convective storms (Figure 4).
-
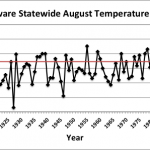
- Figure 1. Delaware statewide mean August temperature (°F) 1895-2016. Red line indicates 1981-2010 normal.
-
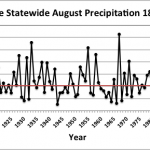
- Figure 2. Delaware statewide August precipitation (inches) 1895-2016. Red line indicates 1981-2010 normal.
-
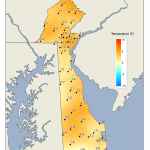
- Figure 3. August 2016 average temperature departures (°F) from the 1981-2010 mean based upon DEOS station data.
-
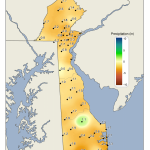
- Figure 4. August 2016 precipitation departures (inches) from the 1981-2010 mean based upon DEOS station data.