August Temperatures
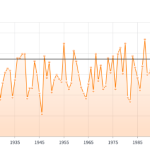
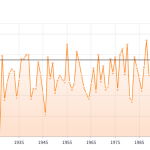
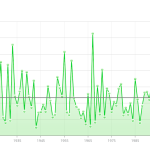
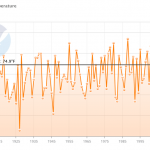
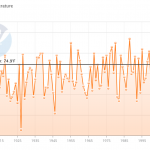
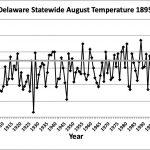
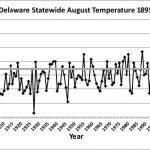
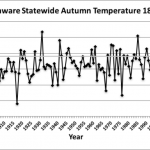
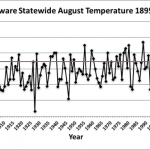
Preliminary data indicates that the statewide average temperature in August was 71.9o F, which is 3.6o F below the 1991-2020 mean value of 75.5o F (Figure 1). August 2025 was tied with August of 1919 as the 19th coolest on record since 1895.
August Precipitation
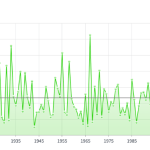
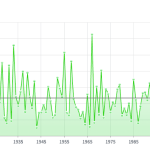
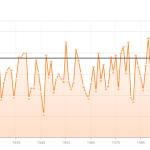
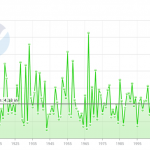
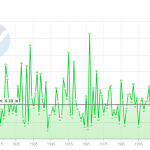
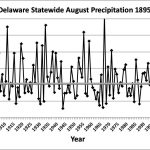
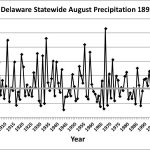
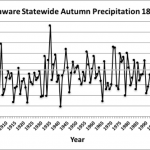
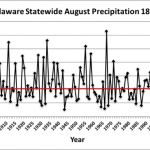
Delaware’s statewide precipitation for August 2025 averaged 2.01 inches, 2.68 inches below the 1991-2020 mean of 4.69 inches (Figure 2). August 2025 was the 15th driest August since records began in 1895.
Statewide Spatial Anomalies
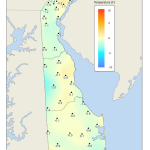
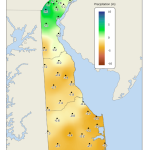
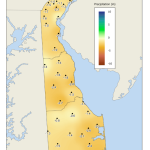
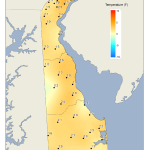
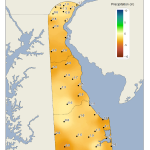
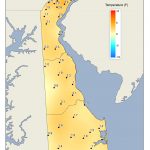
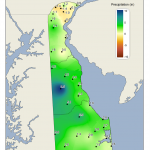
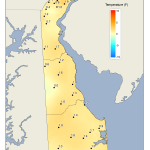
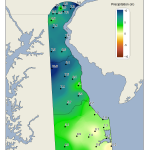
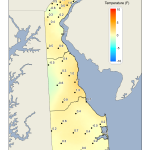
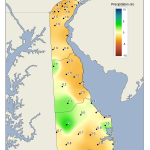
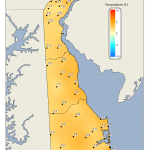
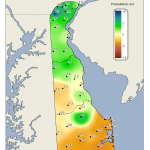
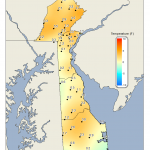
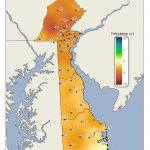
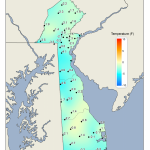
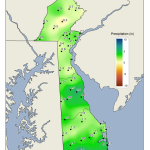
Data from the Delaware Environmental Observing System (DEOS) show that temperature departures were negative across the entire State (Figure 3), with many stations seeing negative anomalies of between 4o and 6o F. Precipitation was below normal Statewide (Figure 4) with most stations recording negative anomalies of between 2 and 4 inches.
National Anomalies
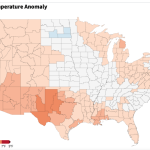
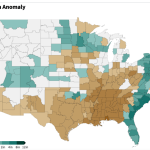
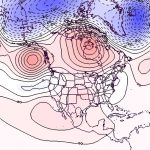
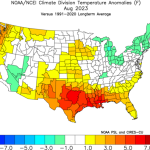
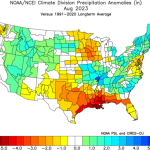
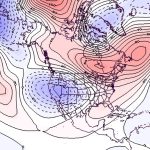
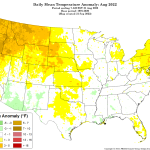
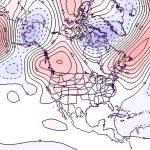
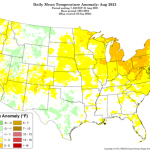
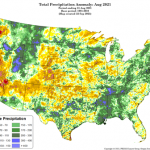
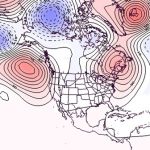
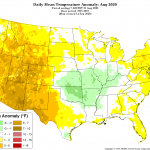
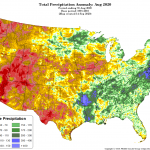
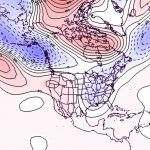
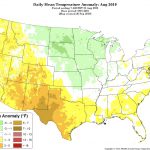
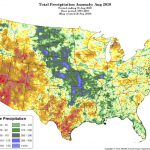
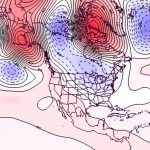
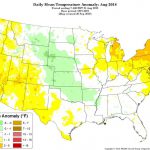
Temperatures were above normal across most of the western United States, while most of the eastern portions of the country saw near or below normal temperatures (Figure 5) except for the Gulf Coast, the Great Lakes, and New England which all saw mildly warm conditions. Precipitation varied across the country (Figure 6) with much of the eastern portions of the United States seeing negative precipitation anomalies from New England through the Ohio Valley, and across the upper Great Lakes. Most of the western United States recorded near normal precipitation for the month. The 500 hPa height pattern for August showed a weak jet stream ridge across the western one-half of the country, contributing to the generally positive temperature anomalies across that region (Figure 7).
Global Anomalies
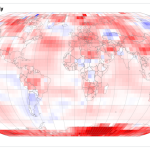
August 2025 ranked as the third warmest August on record for the globe since 1850. Global temperatures were 1.93o F (1.07o C) above the 1901-2000 mean. Particular warmth was found across northern North America, Greenland, northern portions of Asia, and parts of Antarctica (Figure 8).
-
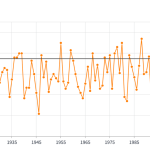
- Figure 1. Delaware statewide mean August temperature (degrees F) 1895-2025. The black line indicates the 1991-2020 normal (NOAA, NCEI, Climate at a Glance: Statewide Time Series).
-
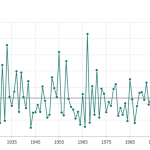
- Figure 2. Delaware statewide August precipitation (inches) 1895-2025. The Black line indicates the 1991-2020 normal (NOAA, NCEI, Climate at a Glance: Statewide Time Series).
-
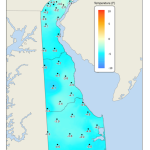
- Figure 3. August 2025 average temperature departures (degrees F) from the 1991-2020 mean based upon DEOS station data.
-
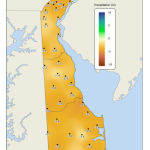
- Figure 4. August 2025 precipitation departures (inches) from the 1991-2020 mean based upon DEOS station data.
-
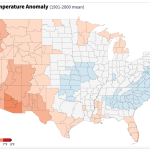
- Figure 5. United States climate division temperature anomalies (degrees F) for August 2025 (NOAA, NCEI, Climate at a Glance: Divisional Mapping).
-
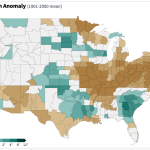
- Figure 6. United States climate division precipitation anomalies (inches) for August 2025 (NOAA, NCEI, Climate at a Glance: Divisional Mapping).
-
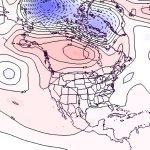
- Figure 7. 500 hPa geopotential height anomalies for August 2025. Negative (blue) anomalies indicate the presence of an anomalous jet stream trough while positive (red) height anomalies indicate the presence of an anomalous jet stream ridge.
-
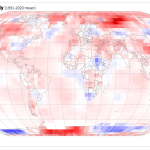
- Figure 8. Global temperature anomalies (degrees C) for August 2025 (NOAA, NCEI, Climate at a Glance: Global Mapping).