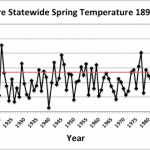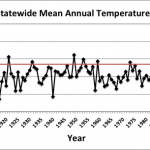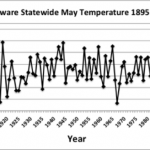
May Temperatures
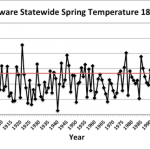
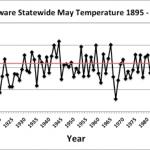
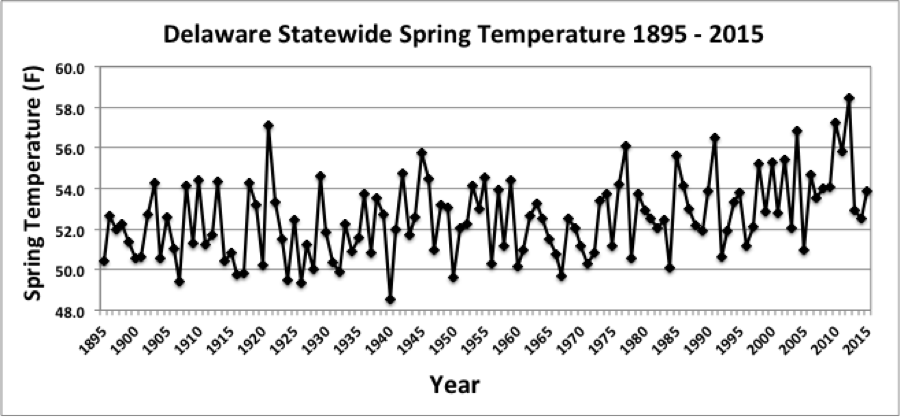
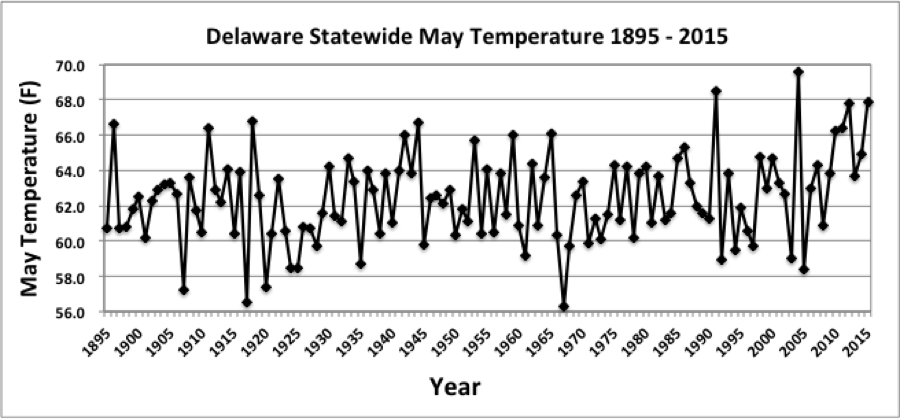
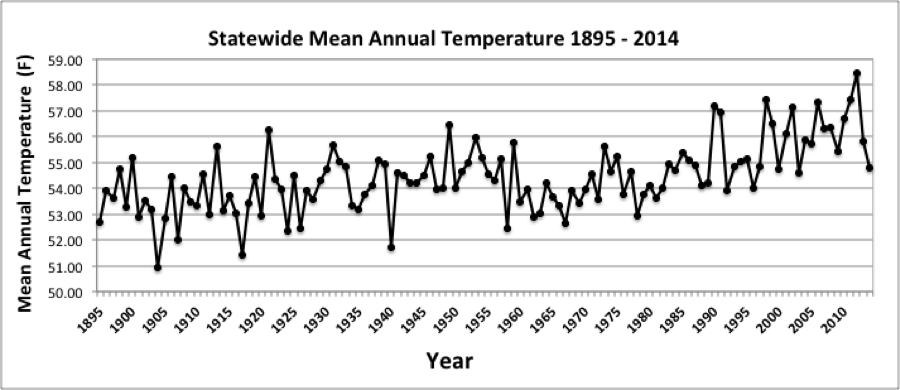
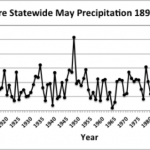
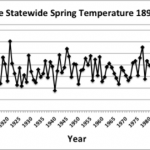
Preliminary data indicates that the statewide average temperature in May was 62.8°F; this was 0.1°F above the 1981-2010 normal of 62.7°F (Figure 1).
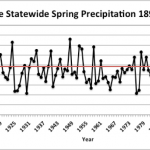
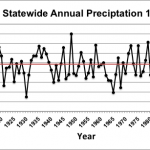
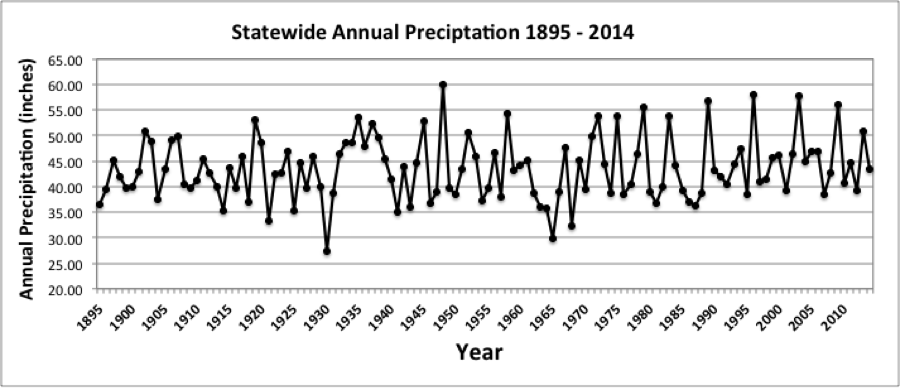
May Precipitation
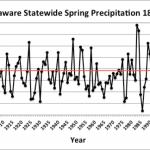
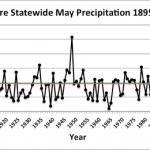
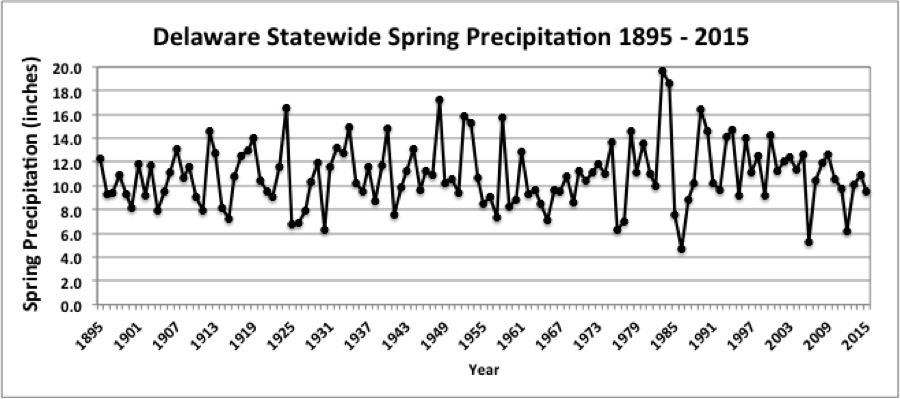
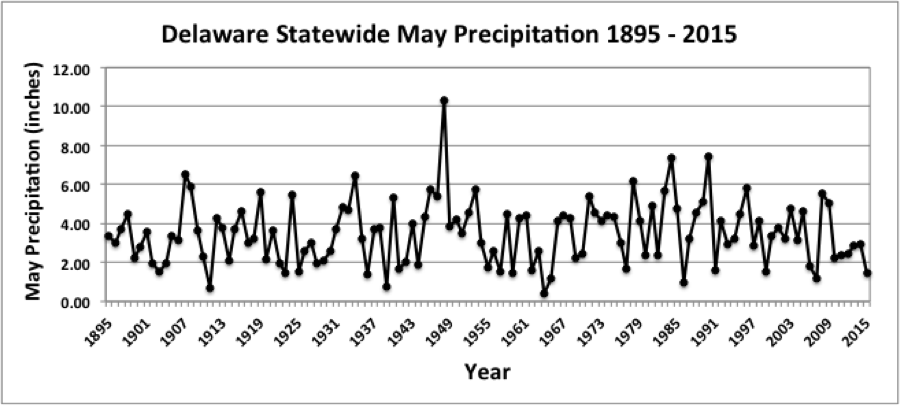
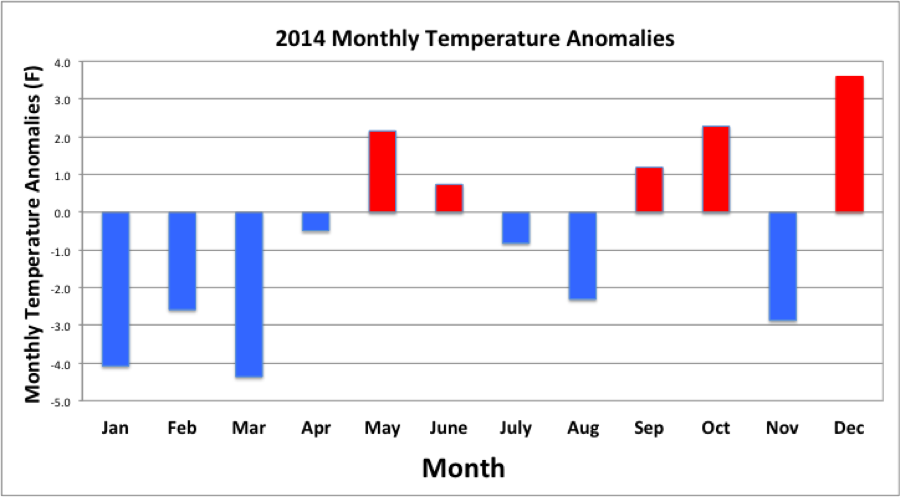
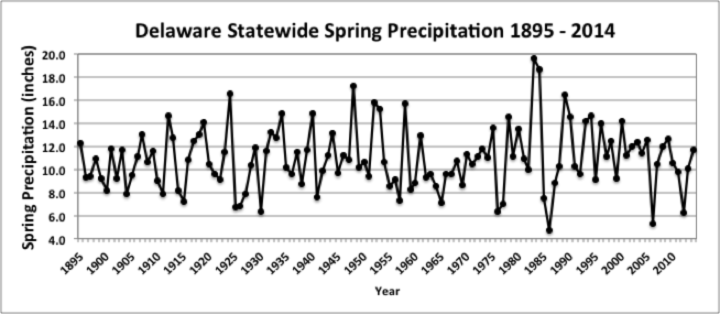
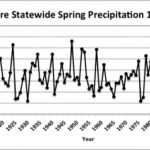
Delaware’s statewide precipitation for May 2017 averaged 5.92 inches, 2.06 inches above the 1981-2010 mean (Figure 2). May 2017 was only the second of the last eight months with above normal precipitation across the First State.
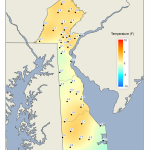
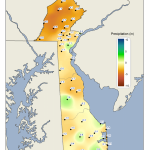
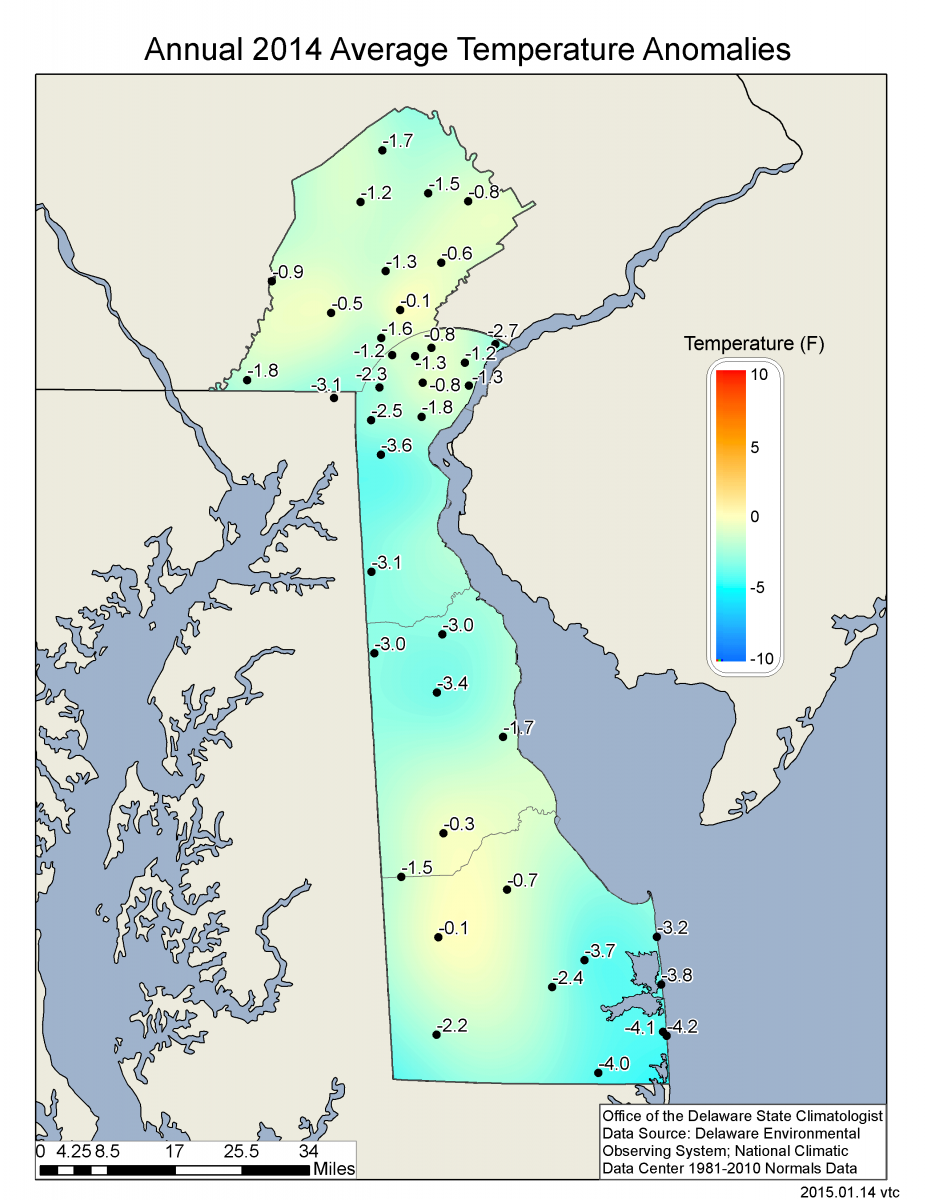
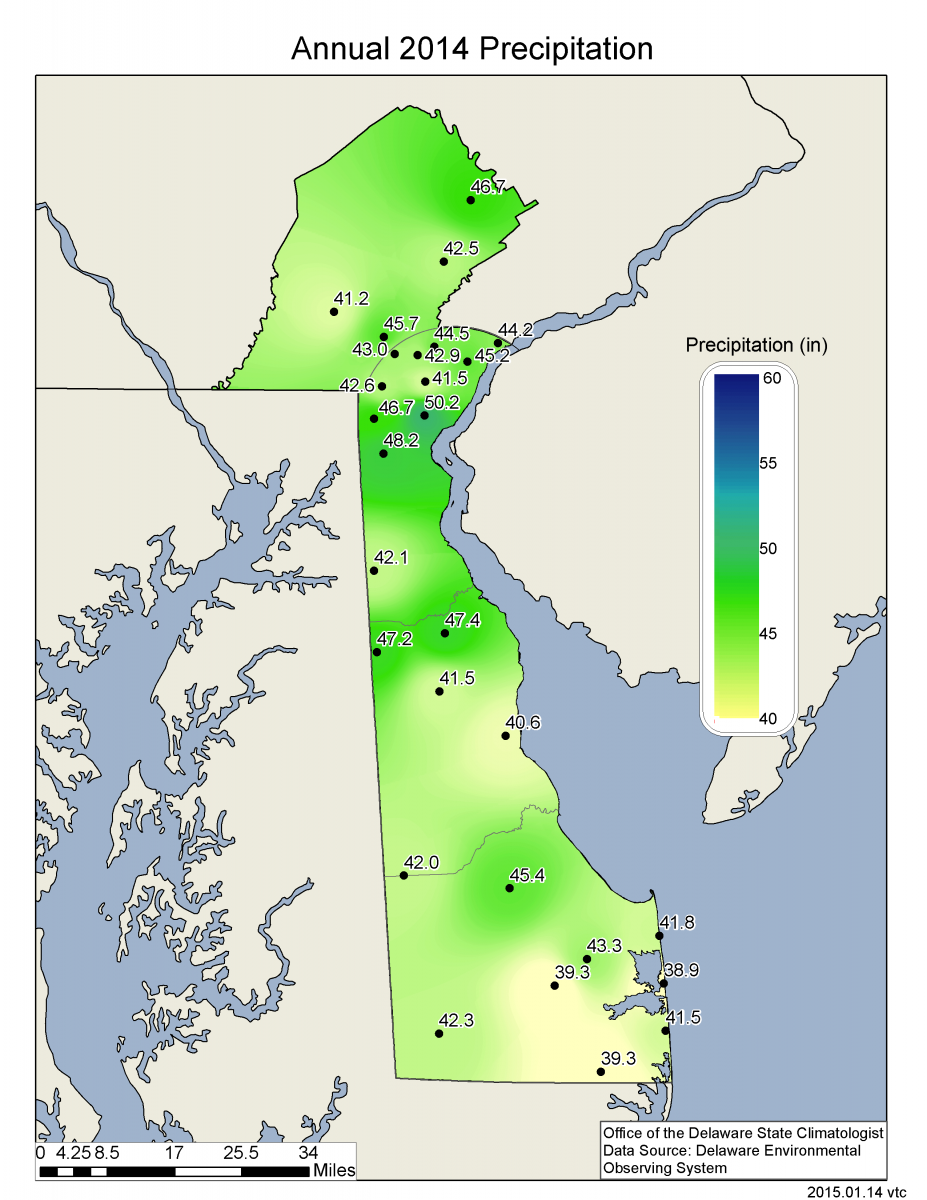
Statewide Spatial Averages
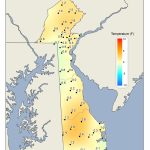
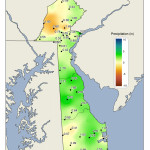
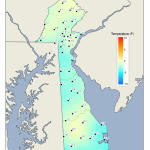
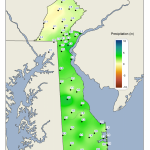
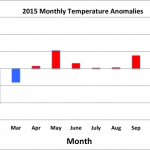
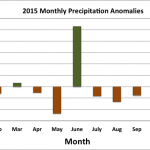
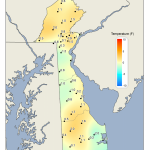
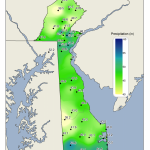
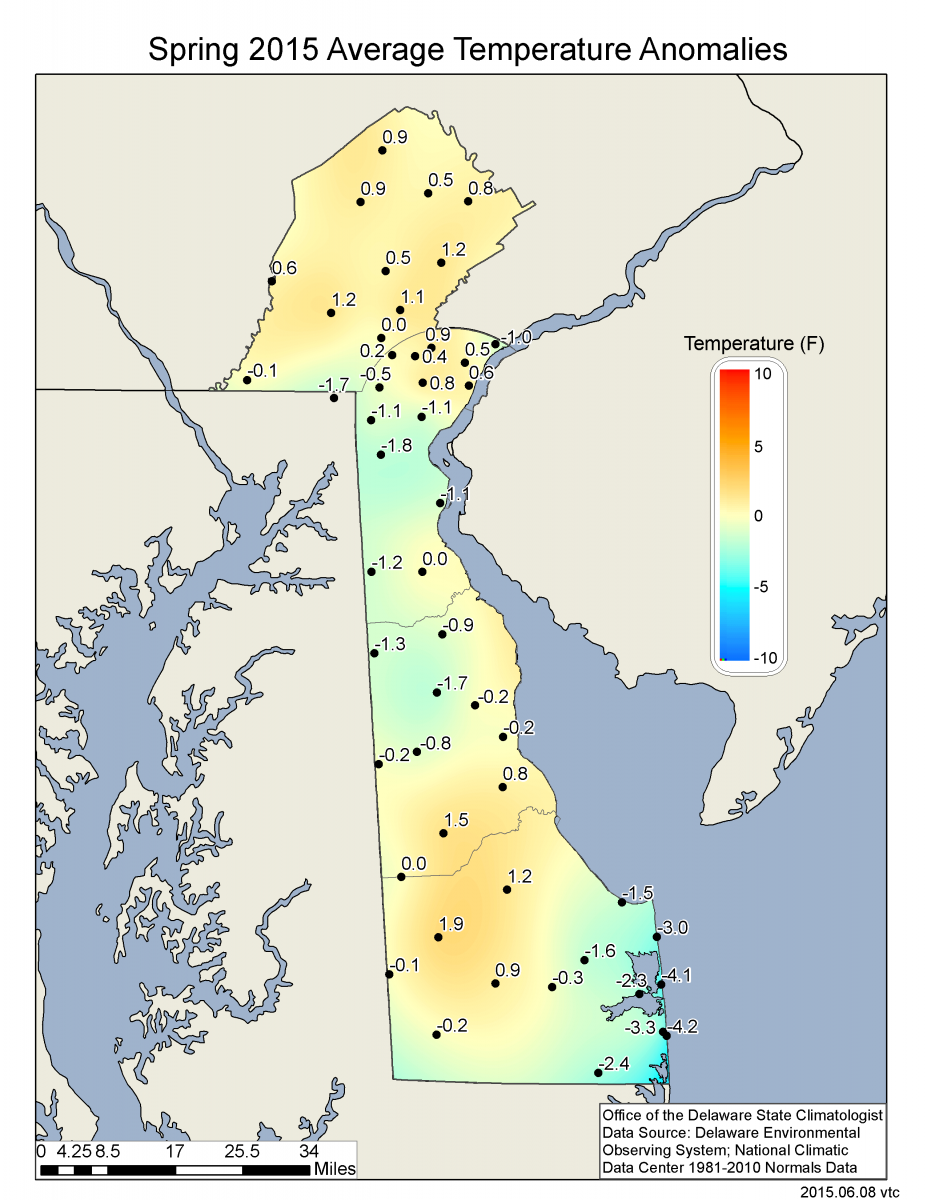
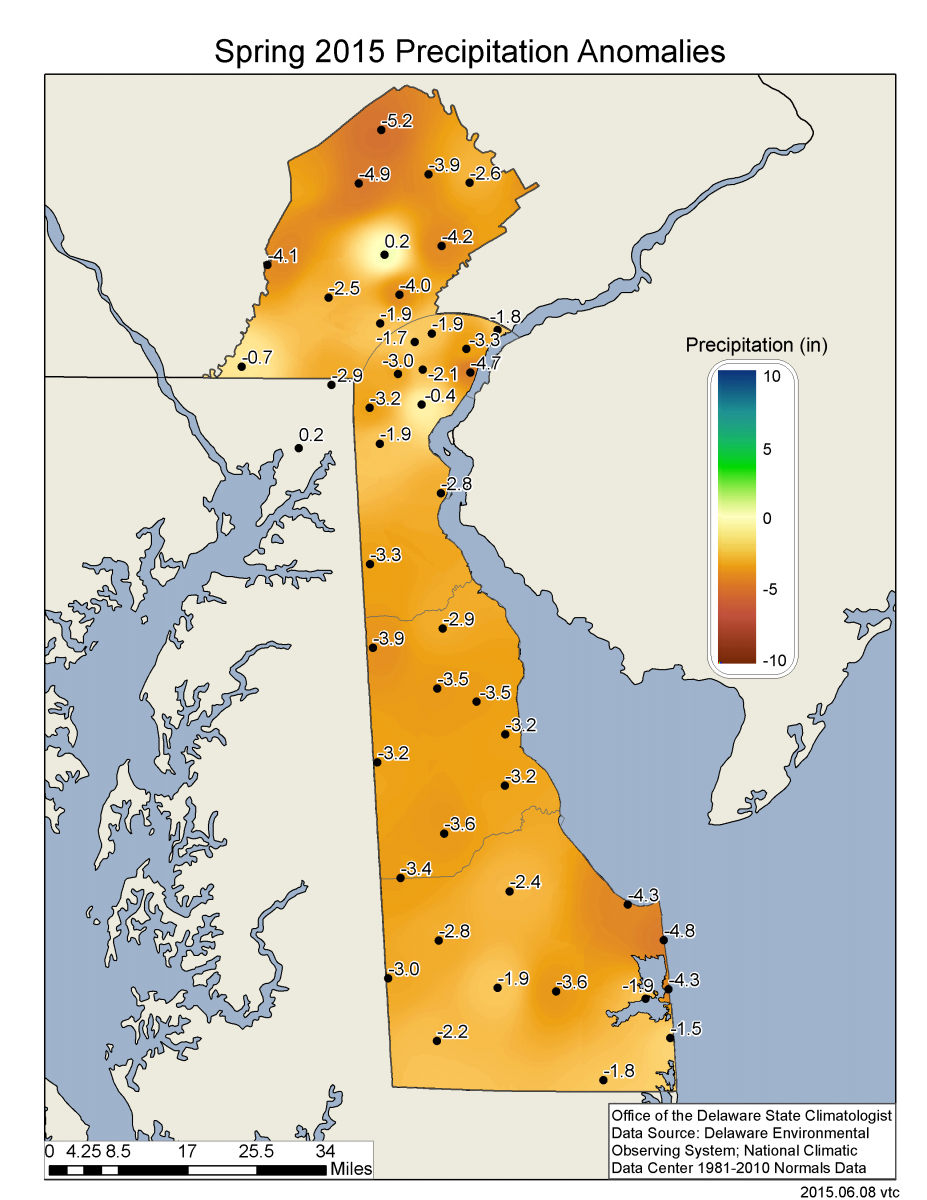
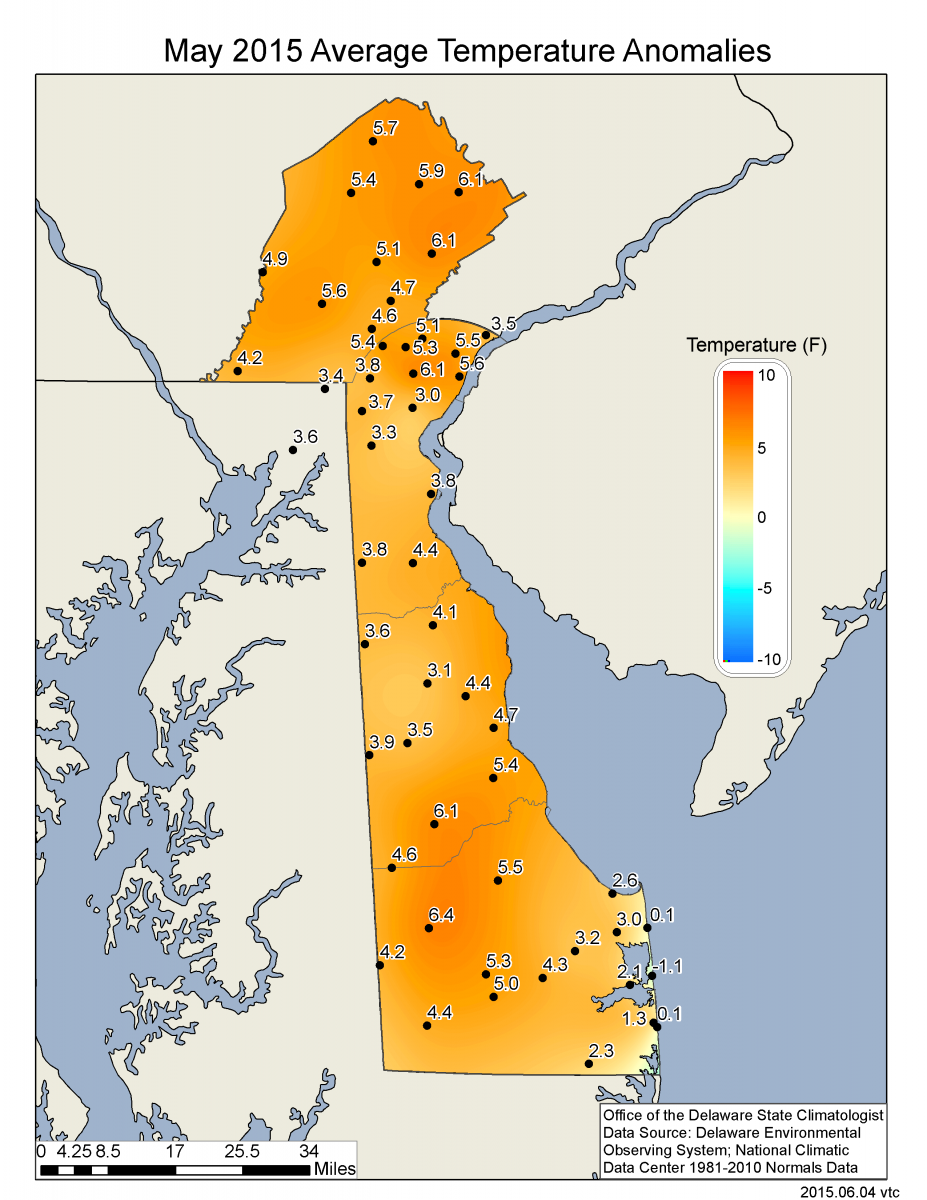
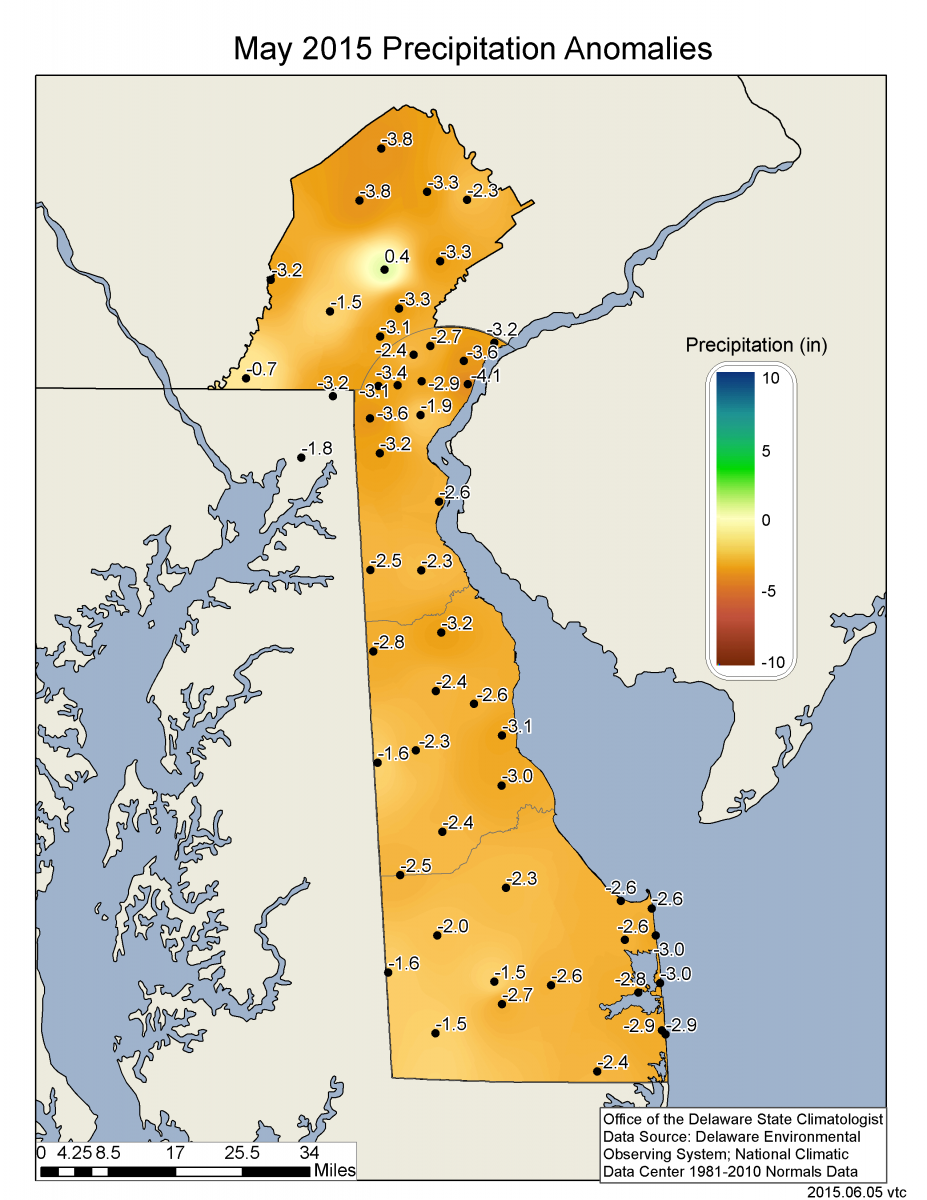
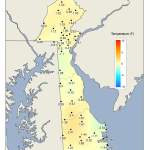
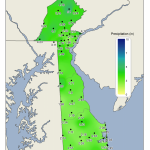
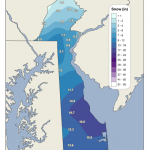
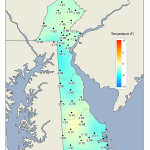
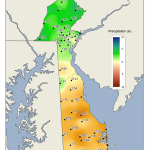
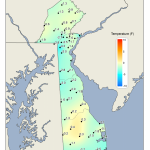
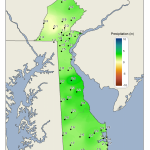
Data from the Delaware Environmental Observing System (DEOS) shows that temperatures varied greatly across the State, with large, negative temperature anomalies found in western New Castle and northern Kent Counties (Figure 3). Precipitation was above average at all sites statewide, with the largest positive anomalies across central Delaware (Figure 4).
-
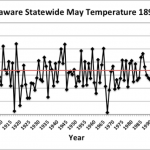
- Figure 1. Delaware statewide mean May temperature (°F) 1895-2017. Red line indicates 1981-2010 normal.
-
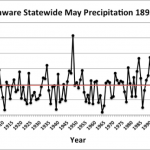
- Figure 2. Delaware statewide May precipitation (inches) 1895-2017. Red line indicates 1981-2010 normal.
-
- Figure 3. May 2017 average temperature departures (°F) from the 1981-2010 mean based upon DEOS station data.
-
- Figure 4. May 2017 precipitation departures (inches) from the 1981-2010 mean based upon DEOS station data.